Best Practices for Manufacturers 3D LUT Implementation
By Tom Schulte
Summary
Video display manufacturers realize that modern digital display panels exhibit a number of non-linear color rendering errors that can be corrected only with a 3D lookup table (LUT) of color correction values. A number of video display manufacturers have begun including direct load capability for a 3D cube LUT in their newer displays, which is the most convenient method to implement 3D display calibration LUTs. There have been questions, however, about the optimum placement of 3D LUTs with respect to the other calibration stages within a display’s signal pipeline and about the interaction of the 3D LUT with other calibration adjustments.
This paper is targeted at hardware manufacturers or anyone who wants a better understanding of how signal pipelines work with 3D calibration LUTs. It covers some of the relationships between the calibration elements in a display controller’s signal pipeline and discusses best practices for arranging the calibration stages in the pipeline and adjusting the individual calibration stages. If you are designing a signal pipeline from scratch, you will see how to structure the pipeline for optimum display calibration control.
This paper also shows how Calman can be an extremely versatile 3D LUT research tool, to investigate and troubleshoot a display’s performance with and without various types of LUTs, using the 3D virtual LUT within Calman to emulate various LUT configurations. Calman can also help investigate the performance effects of different off-the-shelf integrated processing chips. We explain how Calman can show the visual effects and artifacts of different LUT configurations and help you choose an optimum 3D LUT style for any display.
Video Display Signal Pipeline
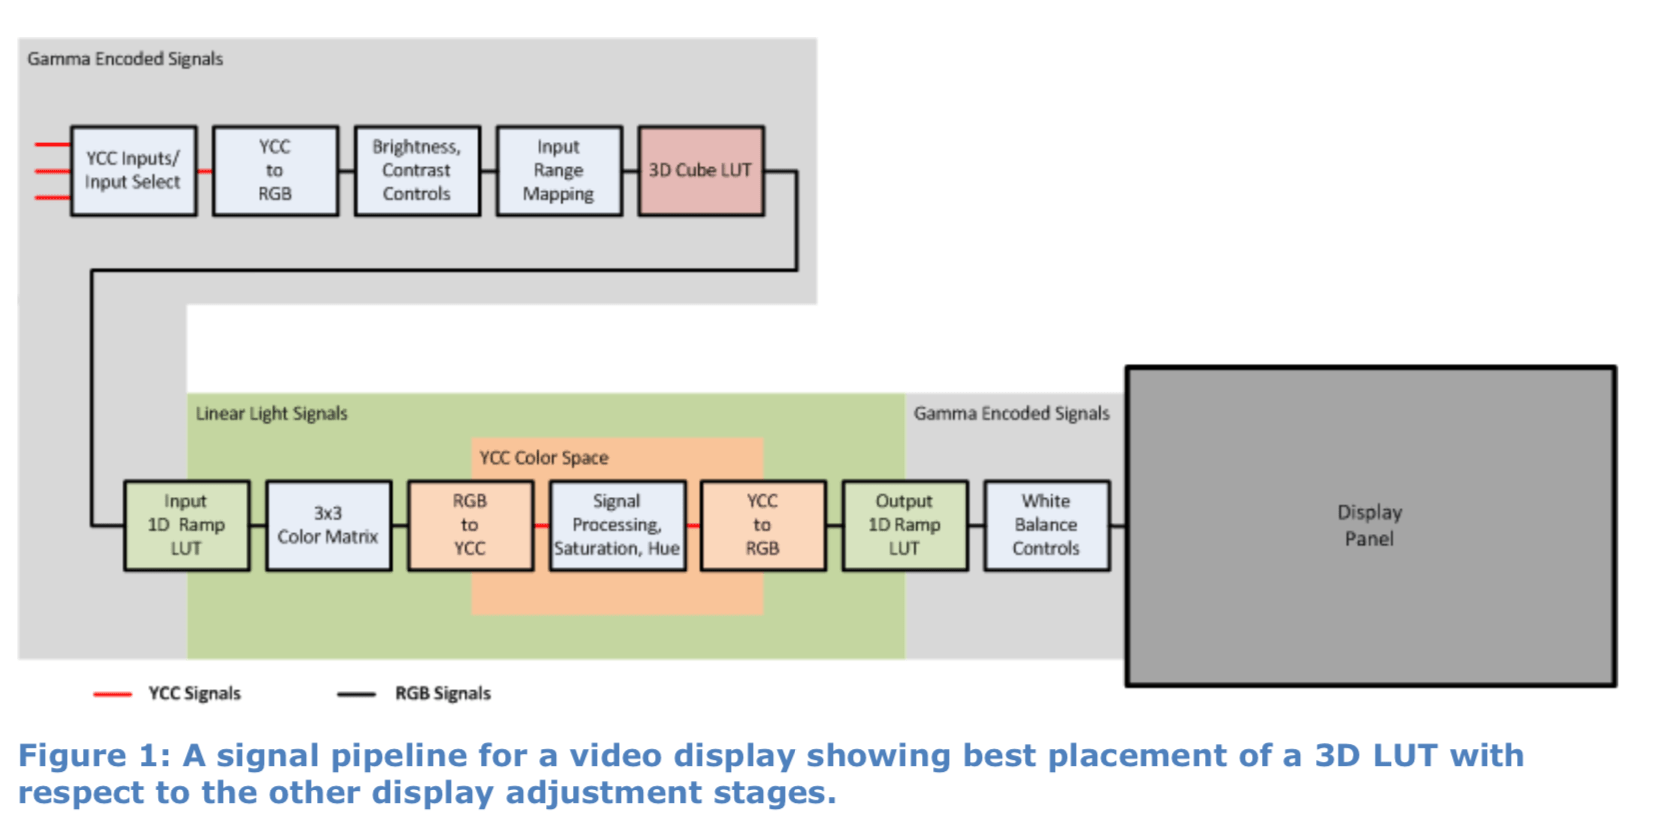
A simple block diagram of a signal pipeline in a video display is shown in figure 1, below. This block diagram indicates a typical placement of the stages affecting display calibration. The pipeline includes a 3D cube LUT plus input and output 1D ramp LUTs, a color matrix, and white balance controls that are all used to correct display inaccuracies.
Following is a short description of each stage, to help show how the 3D LUT integrates with the other display adjustment stages.
Note: The simpler signal pipeline of an RGB computer monitor is presented at the end of this section.
YCC Input/YCC Input Select
The input signal at a video display’s SDI or HDMI video inputs is normally a YCbCr (YCC) color space signal with gamma encoded color and grayscale luminance values.
Signal pipeline Bit Depth
The primary goal for a color-critical video display is to accurately render color input signals to a displayed image. The display’s signal pipeline needs to minimize image artifacts due to rounding errors and image gradation errors. To accomplish this, the bit depth of the display panel should match the greatest color depth of the video input signal. The bit depth of the 3D and 1D LUTs in the signal pipeline should be at least 2 bits greater than the video input, and the bit depth of the signal processing should be at least 2 bits greater than that of the LUTs.
YCC to RBG Conversion
The display imaging panel or light engine, as well as most of the signal processing stages, works with RGB signals. This YCC to RGB Conversion stage converts the YCC input signal into RGB color space, through a standard linear conversion matrix. The resulting red, green, and blue video signals maintain the input signal’s original gamma coding.
Brightness/Contrast Controls
If the Brightness control in a video display is positioned before Input Range Mapping, a display operator can adjust the Brightness control to temporarily raise the low signal levels and view content below SMPTE black (16/64). This assumes that the video display Brightness control adjusts the black level offset of the video signal, versus the Brightness control on an RGB monitor that adjusts the display panel backlight.
If the Contrast control is also positioned before Input Range Mapping, the operator can adjust the Contrast control to temporarily lower the high luminance signal values and view content above SMPTE reference white (235/940). To restore any display calibration, however, the brightness and contrast controls then need to be returned to their calibrated positions.
Positioning brightness and contrast controls after Input Range Mapping doesn’t allow readjustment of the controls to see content that is below SMPTE black or above reference white. This is because the Input Range Mapping stage clips image content outside the legal range when the SMPTE range is selected.
Calibration
The Brightness control is calibrated to produce no light on the screen (greater than the display’s native black level) with a black value signal (16/64), with signal values just above black producing barely discernable light.
The Contrast control is calibrated to produce the greatest possible signal gain (dynamic range), without compressing or clipping the highest RGB signal values.
Input Range Mapping
This stage maps the signal range of different types of input signals (SMPTE, SMPTE plus, Extended/Data) to the signal pipeline’s maximum signal range (RGB values 0-255 or 0-1023). This maps black value in the input signal to RGB 0,0,0 and maps either reference white or peak white to the maximum RGB value.
For example, if SMPTE input range is selected, the input signal black level (RGB value 16/64) will be remapped to digital value 0 and the input signal reference white level (RGB value 235/940) will be remapped to digital value 255/1023. Note that, in this case, image values below black and above reference white will be clipped at the stage output.
This allows the entire dynamic range of the signal pipeline to be utilized for the selected input signal range. Since the pipeline’s entire signal range will be exercised and calibrated with any selected input range, this allows the calibration of the signal pipeline to remain correct when another input signal range is selected.
Order of Calibration
To better appreciate the optimum order of the following stages in the signal pipeline, we should next note the best practice for the order in which these stages are calibrated.
We start a display calibration by first setting all of the controls in the pipeline to a neutral setting. We then select the appropriate input range mapping for our normal input signal and calibrate the brightness and contrast controls. This establishes the desired bit levels of the video signals at the output of the Input Range Mapping stage.
Calibration of the stages following Input Range Mapping should begin in the stages closest to the display panel and final adjustments should be made in the stages closest to the signal input. Calibration, then, is performed in an exact opposite order to the flow of signal through the signal pipeline. The last stage (white balance) is calibrated first, and the first stage (3D cube LUT) is calibrated last.
The first calibration adjustments made to a display should correct the most significant rendering errors inherent In the display panel. These coarse adjustments should be made in a video pipeline stage that is as close as possible to the panel. Each of the following adjustments will make progressively finer corrections to the panel’s performance, in stages more and more separated from the panel. The final fine tuning corrections of the panel’s non-linearities will be made in the 3D LUT, the first major calibration stage in the pipeline.
We shall continue discussing the signal pipeline stages in the order of signal flow through them, with the understanding that they are calibrated in the opposite order.
3D Cube LUT
The color correction values in the 3D lookup table correct primarily the linear and non-linear errors that remain in the display’s 3D color space after all other stages have been calibrated. Other than the 1D LUTs, which can correct luminance non-linearities, all other display adjustments correct only linear inaccuracies.
A 3D cube LUT corrects any remaining grayscale errors plus it corrects remaining saturation and hue errors for all 1.07 billion colors in the display’s 3D color space.
The practical sizes of 3D LUTs built into video displays range from 17x17x17 calibrated color data points, to 33x33x33 data points, to possibly as high as 65x65x65 data points. The 3D LUT corrects all 1.07 billion colors in a 10-bit display’s color space, but the correction data for the colors falling between the 3D LUT data points is obtained by performing trilinear interpolation between the calibrated points.
The advantage of having more color data points in the LUT is that there are then fewer interpolated points between adjacent calibrated points. This allows more accurate interpolation, fewer quantization errors, and better output value continuity at the calibrated data points, which yields fewer image artifacts and smoother color gradients in the rendered image. The main disadvantage of a 3D LUT with more color data points is the increased memory storage that it requires.
Order of the stages in the signal pipeline
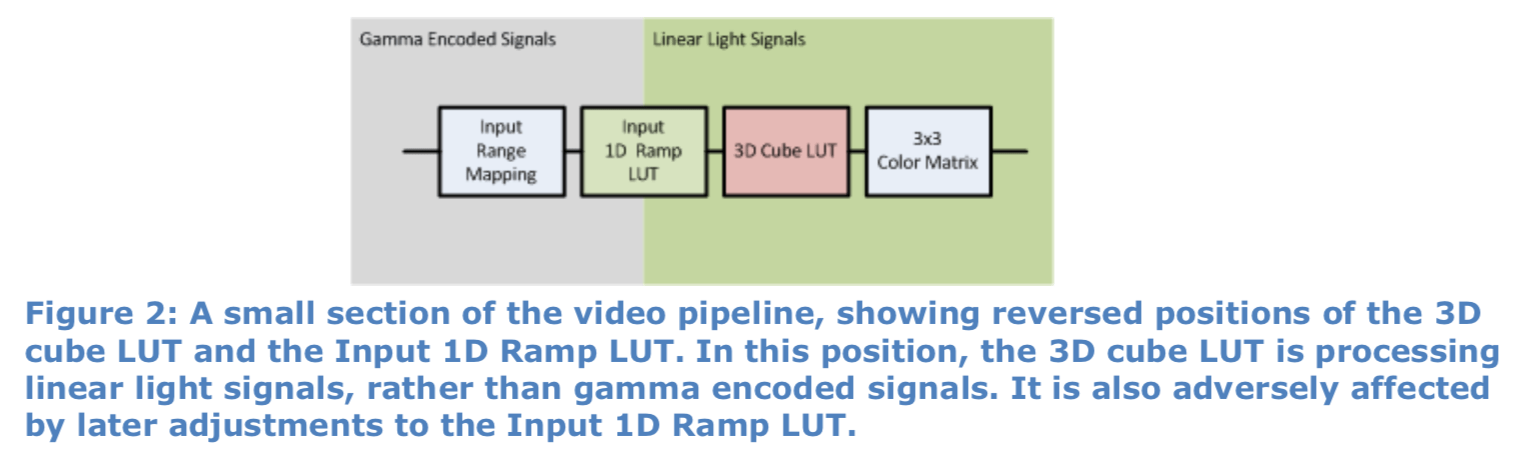
A 3D cube LUT should be placed before other LUTs and other adjustment stages, so that it can be properly calibrated after the calibration of all other stage adjustments is complete. If, for example, the 3D cube LUT is located after the Input 1D Ramp LUT (Figure 2):
- Adjustments of the Input 1D Ramp LUT would shift signal bit values at the input of the 3D LUT. This would affect the entire color space within the 3D LUT, rather than just the grayscale values.
- Calibrating the 3D LUT to provide a linear light signal to the color matrix (which it requires, as discussed below) would require excessive gamma correction in the 3D LUT, especially at low bit values. The related low bit value interpolation would then create significant signal value ringing effects and banding artifacts.
- With the 3D LUT acting upon linear light signals, after the 1D LUT, the lowest node in the 3D LUT is at a much higher luminance level (for a 17 point LUT, about 30% luminance vs. 6% luminance for gamma coded signals), reducing correction control at luminance values just above black.
Likewise, if Brightness or Contrast controls are located before the 3D LUT, they can be used to precisely set the signal bit levels to the 3D LUT input. However, any adjustment of the controls after the 3D LUT is calibrated will change the signal levels to the following stages and will significantly alter the display calibration.
Calibration
The 3D LUT is calibrated by profiling the display’s performance over a large number of color points.
It has been found, though, that accurate results can be obtained by measuring a sparse sample of the color points represented in the 3D cube LUT (35,937 points for a 33x33x33 LUT). Then, in areas of the color space that are found to have the greatest error, additional points are measured to accurately profile the display’s color performance.
Correction data is then calculated for all the 3D LUT color points and is loaded into the LUT. This results in very accurate display correction data, while taking much less measurement time.
Input 1D Ramp LUT
Video cameras and reference video generators produce SMPTE video output signals that are gamma coded with an approximate 1/2.2 gamma factor. A gamma encoded video signal has pixel values that are non-linear with respect to image intensity. However, the gamma encoded signal more closely matches the non- linearity of human perception and makes more efficient use of a limited number of pixel values.
However, for many signal processing computations in video displays, it is necessary to have the video signal in a linear light domain, with pixel values correlating directly to image intensity. The Input 1D Ramp LUT is used to convert or ‘de-gamma’ the video signal to a linear light domain so that the color matrix that follows can work accurately (Figure 3).
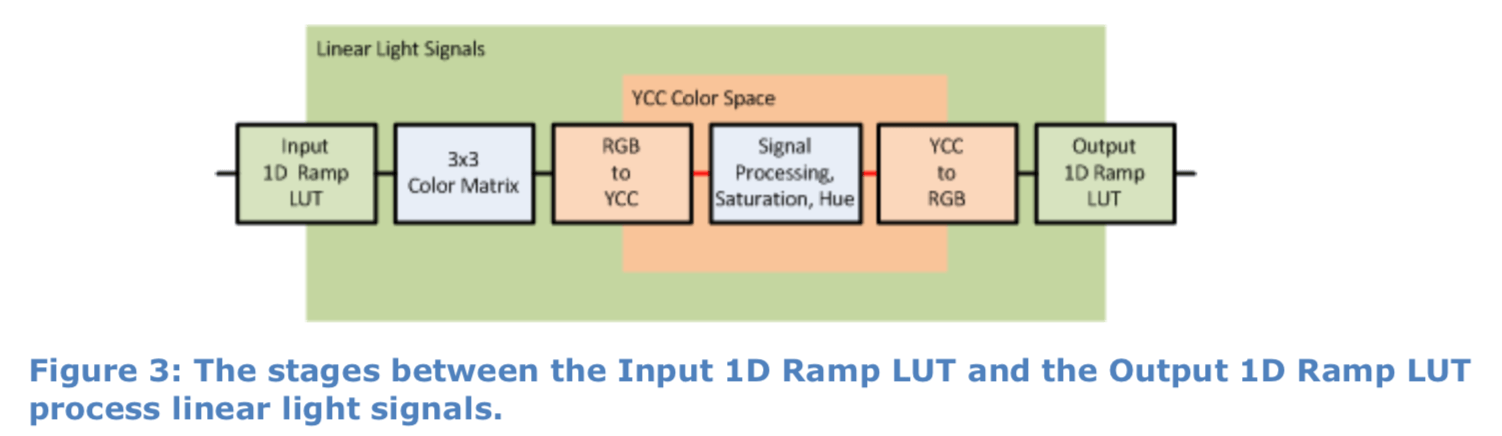
The Input 1D Ramp LUT should contain default values from the factory that convert the standard 1/2.2 gamma coded input signal into a linear light signal. If there is no 3D cube LUT preceding the Input 1D Ramp LUT, there should also be provision for calibrating the 1D LUT, to correct luminance non-linearities in the linear light section of the video pipeline.
Calibration
If there is a 3D cube LUT preceding the Input 1D Ramp LUT, no calibration of the Input 1D Ramp LUT is necessary, as the 3D LUT calibration will provide all the signal correction that might otherwise be provided by calibrating the Input 1D Ramp LUT.
If there is no 3D cube LUT preceding the Input 1D Ramp LUT, calibrate the input 1D LUT to correct luminance non-linearities in the linear light section of the video pipeline.
3×3 Color Matrix
Fully saturated red, green, and blue primary colors define the outside edges of a display’s three-dimensional color space. If the saturation of a display’s native RGB primary colors exceeds those of the target primary colors, a 3×3 color correction matrix (Figure 4), placed in the video signal path, can correct the display’s native primary colors to match desired standard primary colors. This matrix might also be expanded to provide correction for the secondary colors. A display’s color space selection and/or CMS color gamut controls change the values in the display’s color matrix.
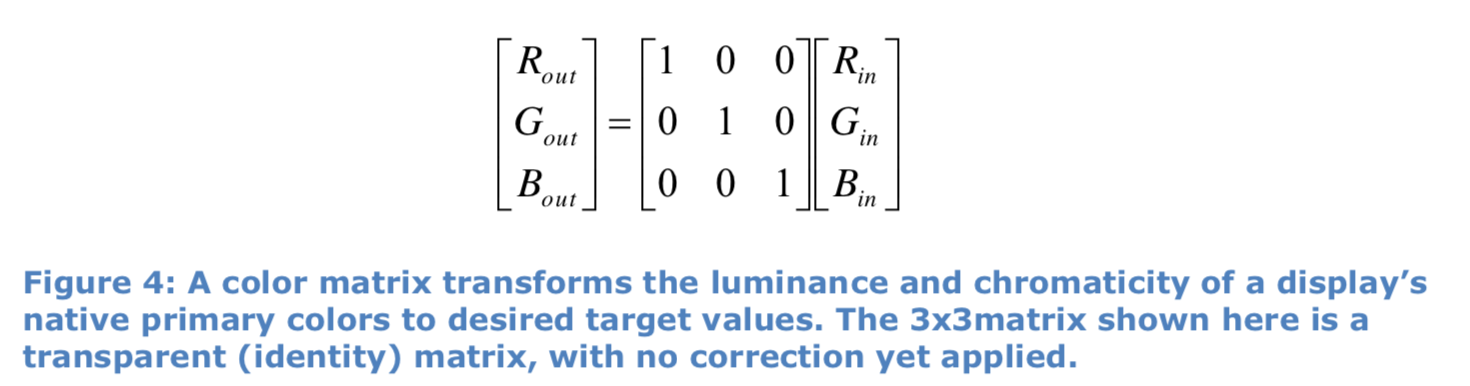
A color matrix requires linear additive input signals to produce accurate output signals. The gamma coded RGB pixel values are converted to linear light coded pixel values by the Input 1D Ramp LUT that precedes the color matrix.
The display’s signal processor uses the values in the color correction matrix (Figure 4) to perform a linear color transform on each pixel in the incoming signal. The full correction values are applied to fully saturated primary colors and linear scaled correction values are applied to all less saturated colors. Since a color matrix produces linear scaled correction values, nonlinear luminance errors and saturation errors are not corrected for less than fully saturated colors. One advantage of using a color matrix to perform the bulk of a display’s color space correction is that the matrix operation is entirely linear and doesn’t produce any ringing or quantization errors.
Calibration
The display’s color space selection should first be set to select the display’s native color gamut, or at least a selection yielding primary colors that are oversaturated, compared to the target primary colors. The display’s CMS controls are then adjusted to correct the luminance, saturation, and hue of each primary and, possibly, each secondary color.
RGB to YCC
Many image processing operations, including saturation and hue adjustments, must be performed in a linear luminance domain, in a YCC color space with one luminance and two color difference channels. This stage converts the RGB video signal to YCC color space with a standard matrix operation.
Saturation and Hue
Saturation and Hue controls should be used only as user-preference controls, not as calibration controls. In a digital video display that is receiving digitally accurate video signals there should be no need to adjust these controls. The controls should be set to and left at their default positions for accurate signal rendering.
Calibration
At the start of calibration, the Saturation and Hue controls should set at their default positions for no color correction. The controls should not be adjusted during a calibration process. Any saturation or hue errors will be corrected by first adjusting the color matrix for coarse color correction, and then by adjusting the 3D LUT for fine color correction.
YCC to RBG
The following image processing operations, plus the display panel itself, require an RGB signal. This stage converts the YCC video signal back to RGB color space with a standard matrix operation.
Output 1D Ramp LUT
The RGB video signal needs to be translated back from the linear light domain to the gamma domain for proper luminance rendering at the display panel. The gamma output of the display needs to be a higher value than the source signal gamma, however, to compensate for a visual perception effect in dim surround viewing called simultaneous contrast. The end-to-end gamma of the video coding system was designed to be a little higher than 1, to compensate for this effect.[x]
The ITU-R BT.1886 recommendation specifies a base display gamma of 2.4, with additional correction for a non-zero black level produced by the display. The additional correction equalizes perceived contrast between displays with different black levels.
The display 2.4 gamma spec duplicates the average gamma performance of CRT displays, for which all legacy content was produced and which the camera 1/2.2 gamma of Rec.709 was designed to complement. With source signal 1/2.2 gamma (per Rec.709) and display panel 2.4 gamma (per BT.1886), the end-to-end system gamma is approximately 1.1, as desired for dim surround viewing.
The Output 1D Ramp LUT holds luminance correction values to accurately convert the linear light signals at its input to a gamma coded output that produces the desired gamma performance from the display panel. As well as the signal conversion from the linear light domain to the gamma domain, the correction values in the Output 1D Ramp LUT can also be adjusted to provide:
- Gamma selection
- White balance gain and offset adjustments
- Multipoint grayscale and gamma adjustments
Calibration:
The best practice for calibrating a display’s gamma performance is to first select 2.4 gamma in the display’s picture menu, then adjust the display’s multipoint grayscale and gamma controls to calibrate the display’s output for conformance to BT.1886. This yields a 2.4 gamma base performance, with additional correction for any non- zero black level. The signal processor can then mathematically remap the gamma correction values in the Output 1D Ramp LUT when other gamma values are selected in the display’s picture menu.
If there are not multipoint grayscale and gamma controls, do not attempt to modify the display’s default gamma characteristic with the white balance gain or offset controls. Doing so typically results in discontinuous gamma performance across the display’s luminance range.
Calibration of the white balance or multipoint controls is covered in the following White Balance Controls section.
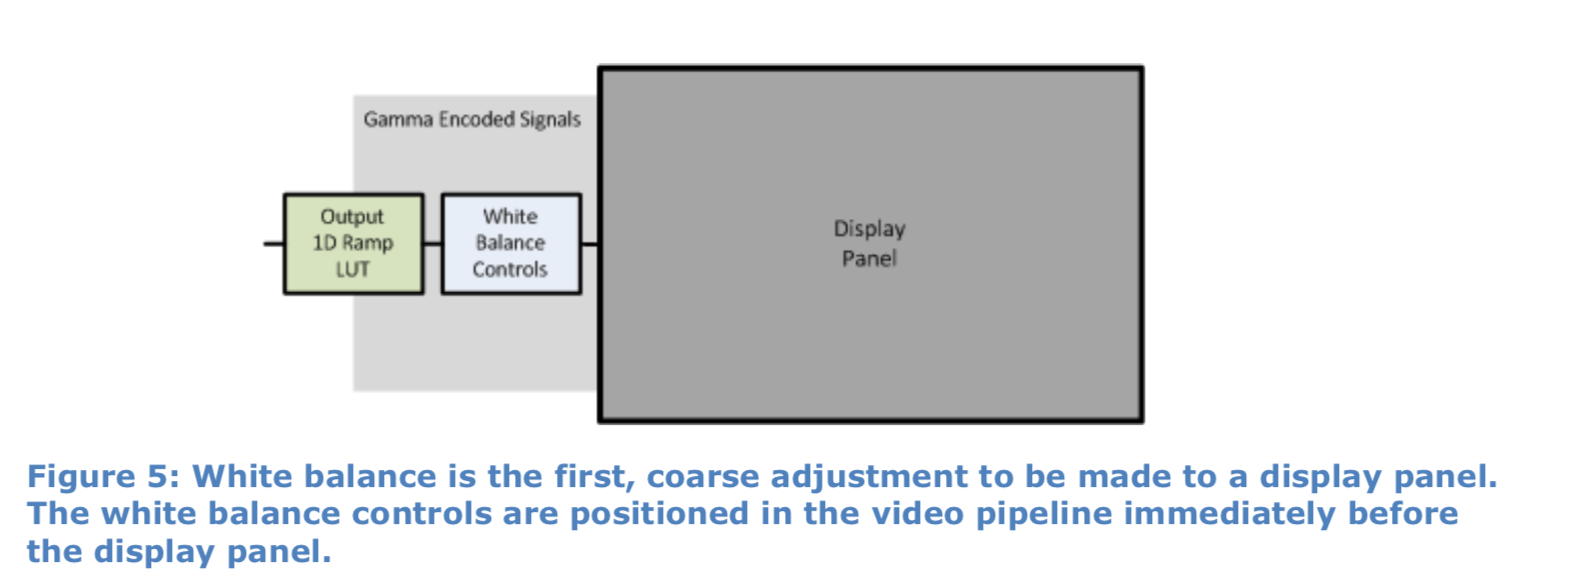
White Balance Controls
The first, coarse adjustment of a display panel is to adjust its ratio of red, green, and blue light output to produce the desired color of white light. This adjustment of a display’s white point is controlled by RGB gain controls, often known as white balance controls (Figure 5). A display may also have offset controls that adjust the lowest luminance grayscale tones for the desired neutral gray, by adjusting the level offsets of the RGB signals.
These white balance controls establish the required balance of red, green, and blue drive values to produce neutral white on the display screen from full white and lower luminance grayscale tones (i.e. 249, 249, 249; 186, 186, 186; 70, 70, 70, etc.) in the video signal. These gain and offset controls typically control the amplitude and bit level offset of the RGB signals by adjusting the correction values in the Output 1D Ramp LUT.
There may be a Color Temp selection in the display’s Picture menu that sets different default ranges for the gain and offset controls.
Calibration:
The RGB gain controls should be adjusted to produce the desired color of white (typically D65) with a reference white signal input. To have the least impact on peak luminance, the green gain control should be left as close to its default value as possible while still obtaining the desired white balance.
If RGB offset controls are provided, they should be adjusted to produce the desired color of white with a 20% gray signal input. Again, the green offest control should be left as close to its default value as possible.
Display Panel
A display manufacturer often purchases the raw display panel, also known as the “glass,” from a separate vendor. The panel contains internal correction to make it perform “in the ballpark” for the intended purpose.
RGB Monitor Signal Pipeline
A simple block diagram of a signal pipeline in an RGB monitor is shown in figure 6, below. Notice that, although the pipeline is simplified compared to that of the video display in figure 1, above, the RGB monitor can include all the same major adjustment stages. The pipeline shown still includes a 3D LUT plus input and output 1D ramp LUTs, a color matrix, and white balance controls.
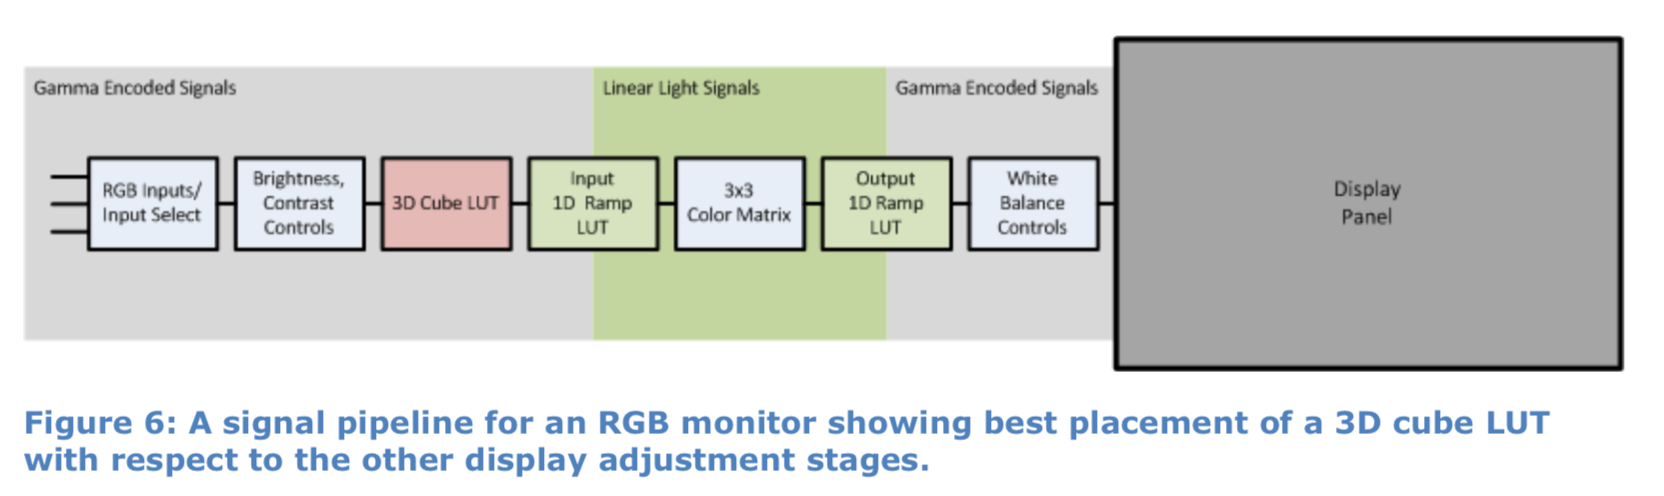
If there is no color matrix or other signal processing, we don’t need the input 1D ramp LUT, as we don’t then need to translate the video signal into a linear light domain.
Calman as a 3D LUT Research Tool
When you are testing a current 3D LUT implementation or planning to implement a 3D LUT in a new display design, you can use Calman’s 3D LUT troubleshooting tools to test the implementation. You can use the Calman virtual LUT to emulate and test various LUT configurations. You can test a panel’s color rendering accuracy with and without different LUT configurations, especially different numbers of data points, to see how much benefit each LUT adds to the panel.
You can create a number of different synthetic LUTs with Calman to test how well different display controller designs, LUT designs, or interpolation algorithms work with a particular display panel.
Synthetic 3D LUT Test Patterns
Calman allows you to create synthetic LUT test patterns and add them to an empty LUT file or to a LUT file containing correction data. These LUT test patterns consist of forced data values with a known data repetition pattern. These LUT patterns aren’t directly viewable on the display screen, but they are revealed in display luminance tests through the active LUT. With these known repetition patterns loaded into the 3D LUT, you are able to test the display performance and see how other stages within the display affect the 3D LUT values.
Spike Split LUT Pattern
For each calibrated grayscale point in the LUT, there is an associated nearest red, green, blue, yellow, magenta, and cyan color point. The Spike Split LUT pattern artificially changes the RGB triplet values for three of these nearest color points to each grayscale point. For grayscale points below 50% luminance, the nearest red, yellow, and magenta points are each intentionally set to triplet values that are 80% of max luminance (e.g. 765, 765, 765). For grayscale points above 50% luminance, the associated red, yellow, and magenta points are each intentionally set to triplet values that are 30% of max luminance.
Although the grayscale LUT values are not altered, when the LUT data points are interpolated to expand from the 17x17x17 LUT points (typical) to the full 1023x1023x1023 color points, the extreme values on the adjacent color points cause ringing grayscale values between the 17 LUT grayscale points. This interpolation ringing is revealed when a luminance measurement series is performed on the display with closely spaced (or single-bit) bit steps (Figure 7).
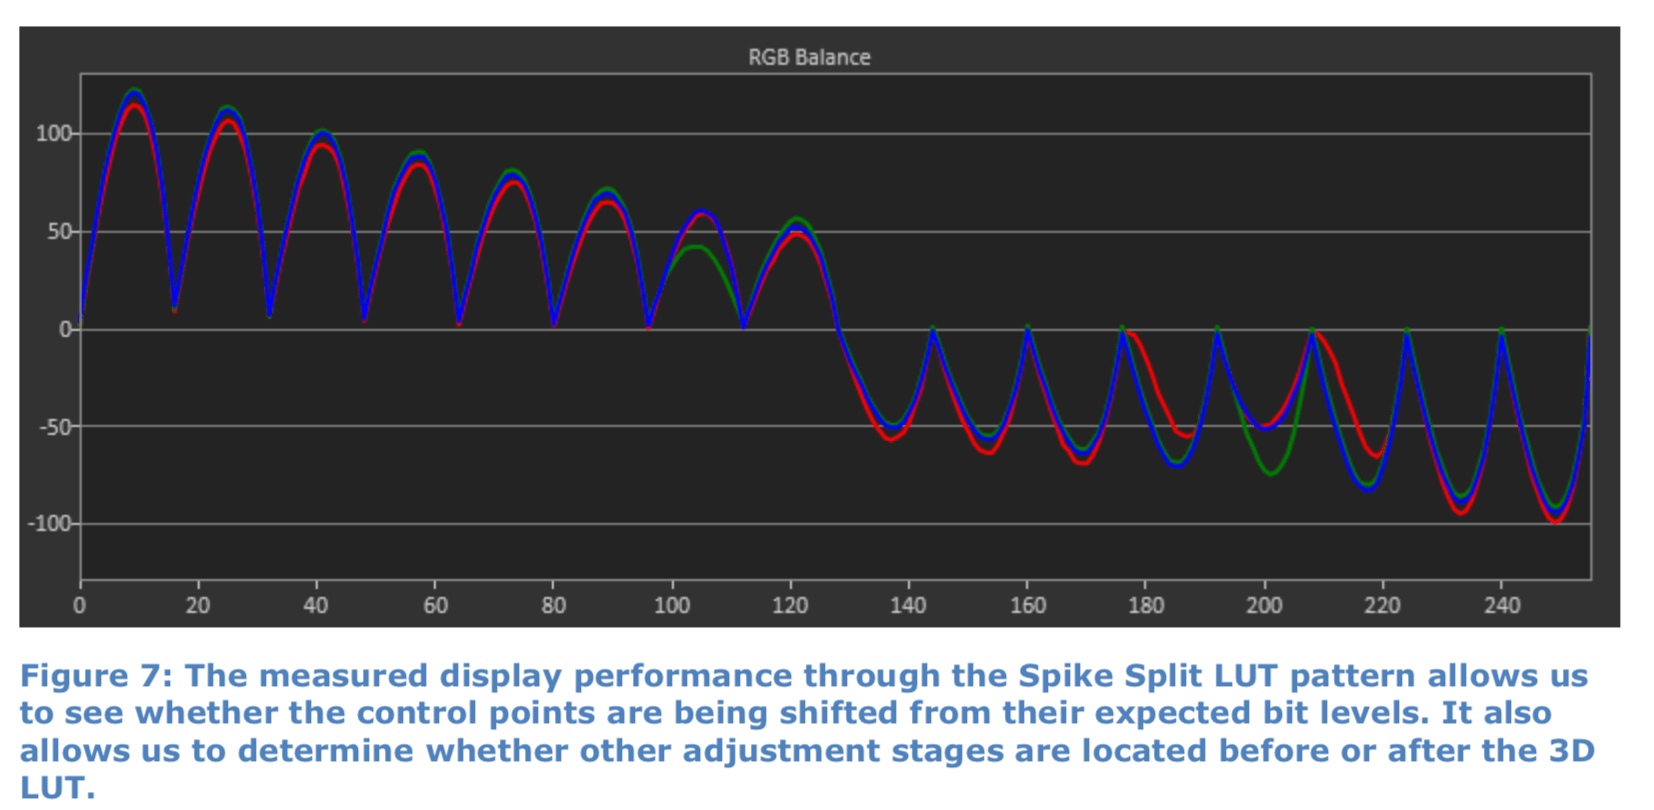
When viewing the resulting performance chart, we see that the bit value location of the original 17 (or 33, or 64) control points is very evident. Depending on the original LUT range (SMPTE, SMPTE plus, or Extended/Full) and number of control points, we can determine the bit values at which the points should be located.
If the control point values are shifted, it may be caused by a misadjusted Brightness or Contrast control, improper Input Range Mapping, improper gamma coding, or possibly by a 1D LUT that is improperly located before the 3D LUT in the signal path.
Controls that are before the 3D LUT change the location of the control points along the x-axis (bit values), but don’t significantly change the amplitude of the ringing peaks.
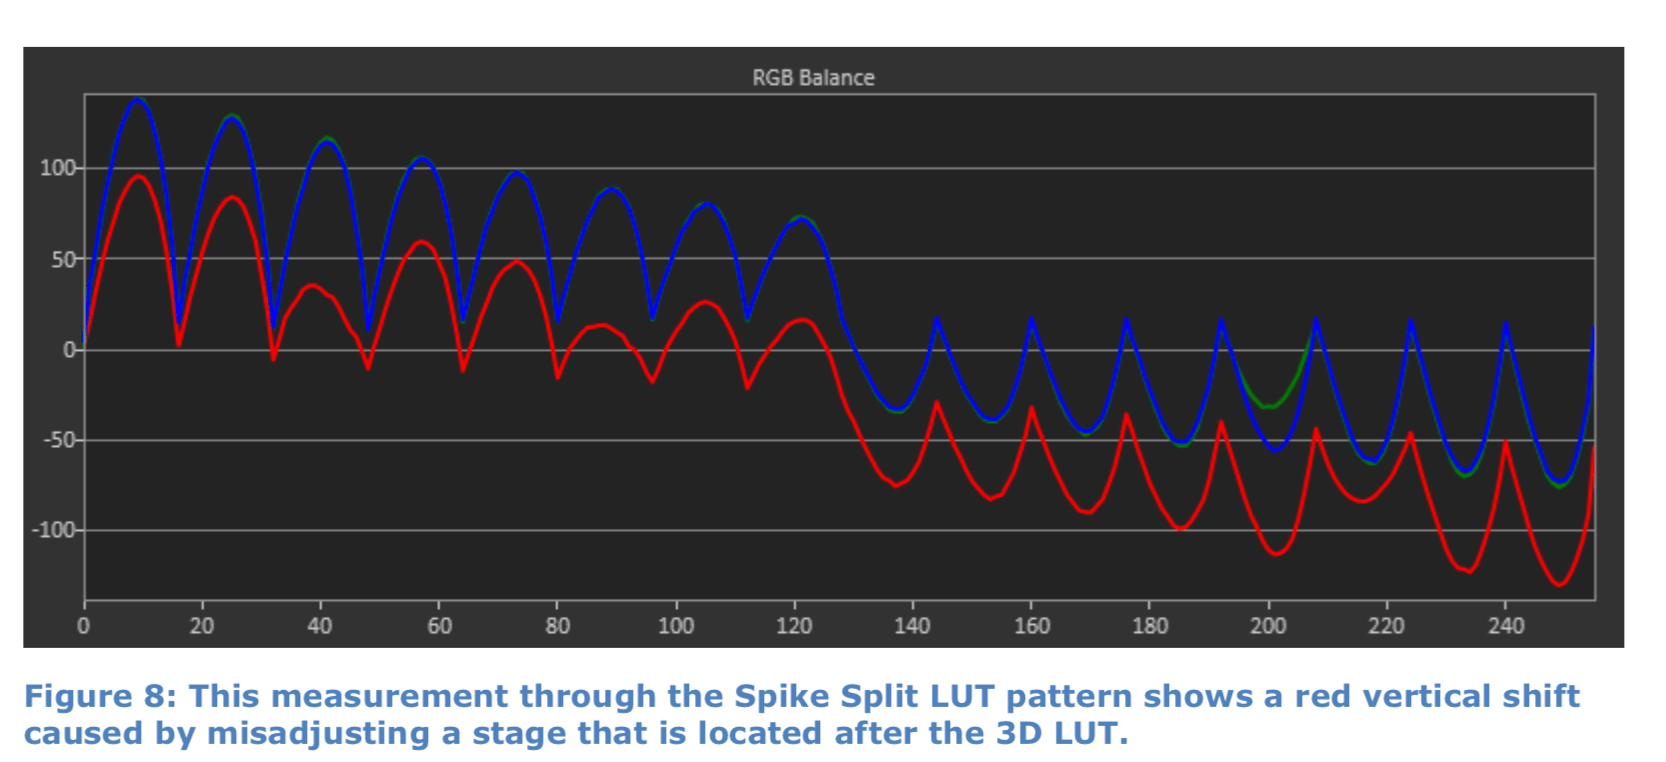
Controls that are after the 3D LUT change the level of the ringing peaks, but don’t change the location of the control points along the x-axis (Figure 8).
Other LUT Test Patterns
The Spike Split LUT pattern is the most versatile of the synthetic 3D LUT test patterns. Calman also creates a number of other LUT test patterns that we will briefly describe here.
- Spike Low, Spike High – The nearest red, yellow, and magenta control points to each grayscale control point are all intentionally set to triplet values that are either 30% (Low) or 80% (High) of max luminance.
- Constant Low, Constant Mid, Constant High – The grayscale control points are all intentionally set to triplet values that are either 30% (Low), 50% (Mid) or 80% (High) of max luminance.
- Inverse – Writes the green grayscale backwards, with selected spikes. Tests a LUT for accepting any arbitrary correction value.
- Box – Squares up all the internal sub-cubes, to obtain linear luminance tracking between control points when writing out the full LUT.
3D LUT Rendered Images
Calman is able to render images through its internal 3D virtual LUT and display them on the calibrated display, on its built-in or pop-out pattern window. The images can be the built-in Calman test patterns or custom user images. This allows you to evaluate the visual effects and artifacts of different LUT configurations.
After you have run the 3D LUT calibration process, using the built-in or pop-out pattern window as the test pattern source, the display correction data resides in Calman’s internal 3D virtual LUT. You would then select any standard Calman test pattern or any custom image that you have loaded into Calman. The selected image will be rendered through the 3D calibration LUT, to show the effect of the correction data on the display’s performance.
You can turn the 3D LUT correction on or off, to show the effect of the LUT on any selected image. You can also load different LUTs that you have created. This allows you to image improvements and artifacts for different LUTs on any selected image.
Custom images can be loaded into the following Calman directory: Program Files\SpectraCal\Calman\Images\UserImages\UserImage{0}.png
Summary
We have shown some of the best practices for implementing a 3D calibration LUT within a video display signal pipeline. We have shown that locating the 3D LUT at the front of the signal pipeline is advantageous and have outlined some of the disadvantages of locating the 3D LUT after other signal adjustment stages.
We have briefly described the other signal adjustment stages and how they work together and with the 3D LUT to achieve accurate color rendering performance.
We have also shown that Calman can assist in implementing a 3D LUT in a new display by serving as a 3D LUT research tool. Calman can generate synthetic 3D LUT test patterns that reveal how a 3D LUT is operating within a display’s signal pipeline, especially with respect to the location of other signal adjustment stages. Calman can also render test images through trial 3D LUTs, to test the effectiveness of various LUT designs with the particular display hardware and software.