Display Profiling Solutions: A report on 3D LUT creation
By Joel Barsotti and Tom Schulte
A number of display profiling solutions have been developed to correct image rendering errors in modern displays. Many of these errors are non- linear color rendering errors that can be corrected only with a 3D lookup table (LUT) of color correction values.
This paper examines the rendering errors that limit display performance, methods of correcting those errors, and an overview of display profiling methods that have been used to create corrective 3D LUTs.
We also present a new display profiling method of creating 3D LUT correction values, which combines elements of two previous profiling methods. We show how this new display profiling method more completely corrects the errors that limit the image rendering accuracy of modern digital displays.
We describe how this new method of 3D LUT creation is easier to use than previous methods and how it is faster, producing an accurate display correction LUT in only two to three hours, or in some cases as little as five minutes.
We show how this display profiling method produces more accurate results with a more time-efficient process and adds a level of flexibility and ease-of-use not available with previous display profiling methods.
3D Color Space
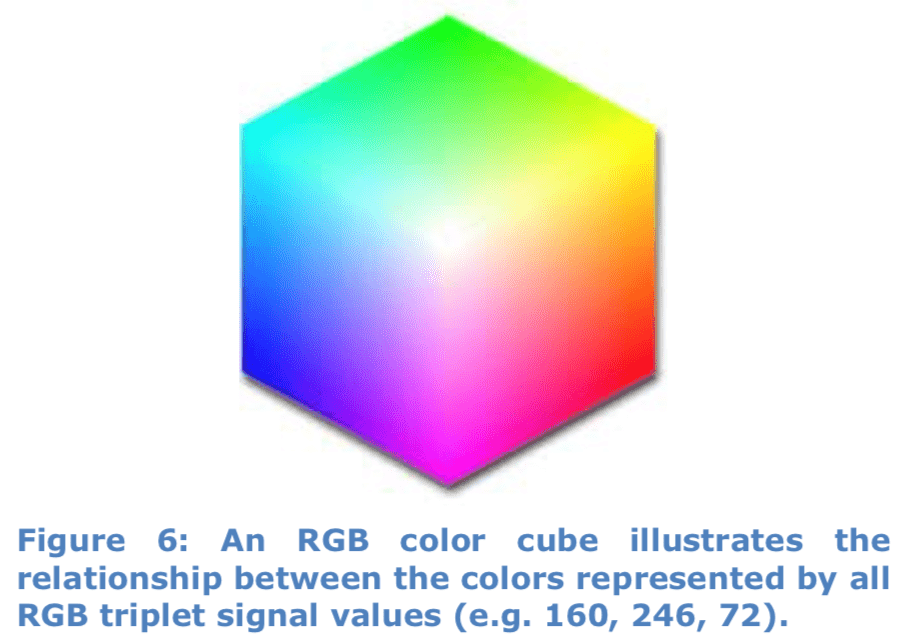
To better visualize the range of colors that a video signal represents or the range of colors that a display is designed to render, we often use a three-dimensional color space representation. We typically use an RGB color cube to visually represent the three-dimensional color space of an RGB video signal (Figure 1).
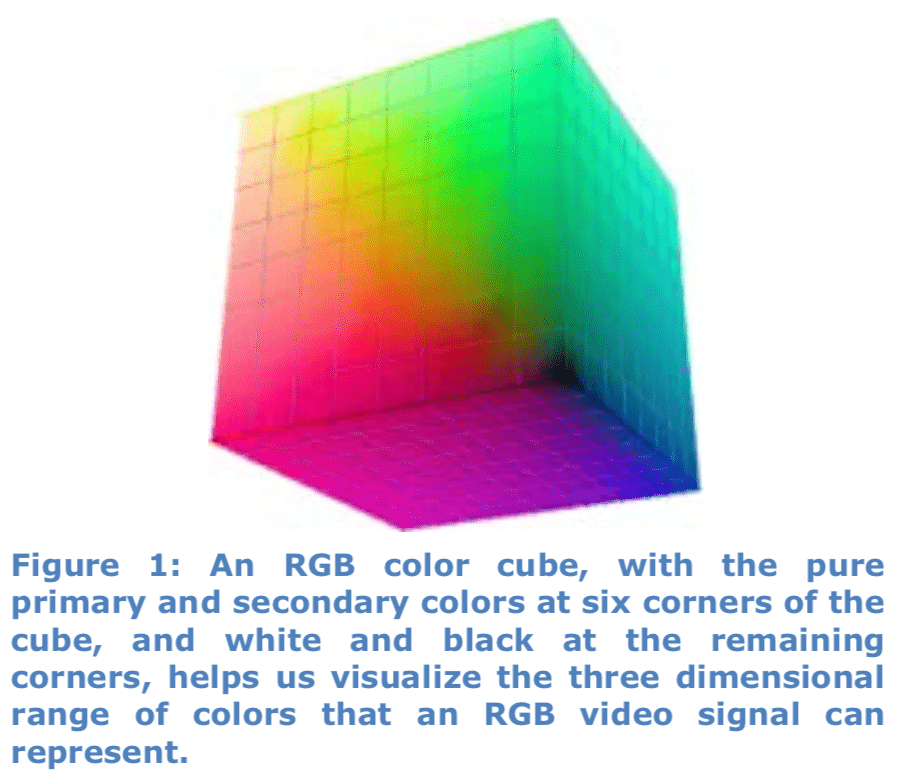
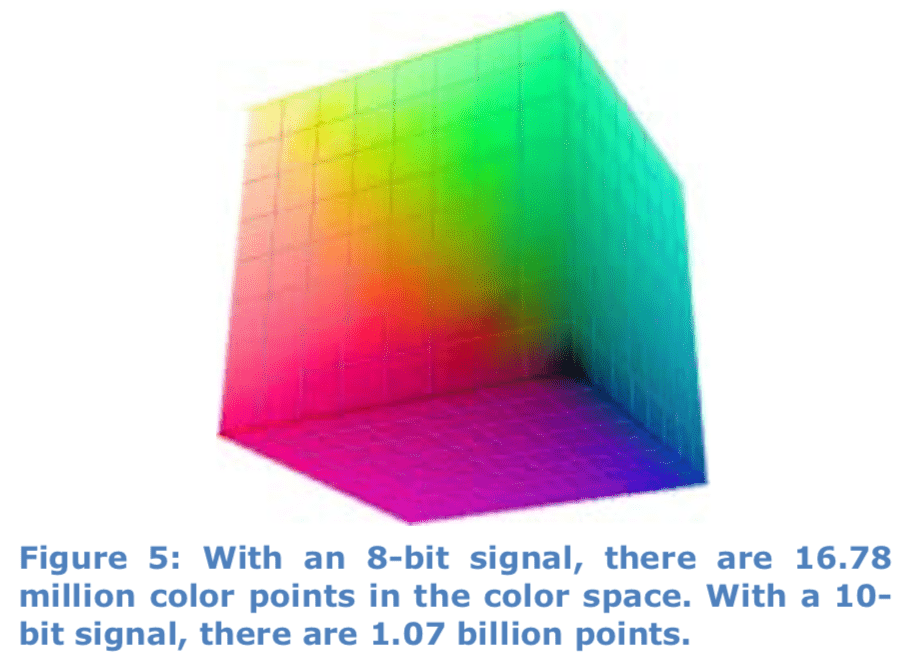
With an 8-bit RGB signal, there are 256 color points along each edge of the cube, with 16,777,216 total color points in the RGB cube, corresponding to the 16.78 million possible colors in an 8-bit digital image (1,073,741,824 values in a 10-bit image).
Each of these 16.78 million or 1.07 billion different colors has a unique combination of hue, saturation, and brightness, and the accuracy of each color is uniquely important for realistically rendering photographic images.
RGB Color Space Basics
In RGB color space, black is at one of the eight cube corners, with the red, green and blue primary colors at the three corners directly adjacent to the black point (Figure 2).
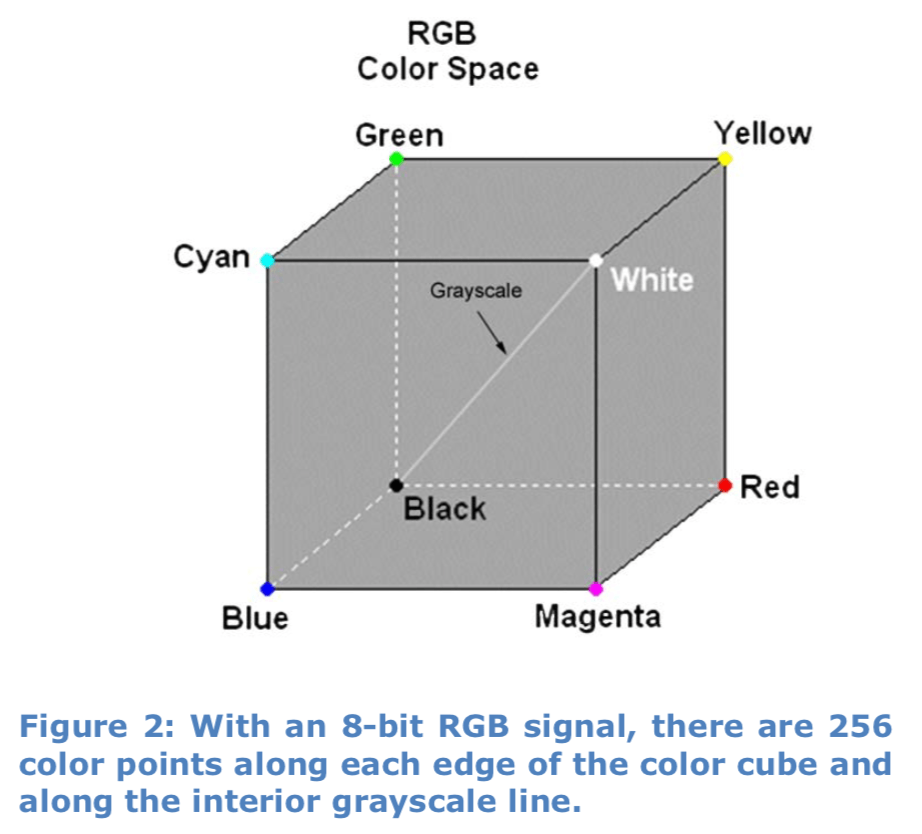
White is at the corner opposite from black, with the cyan, magenta, and yellow secondary colors at the three corners directly adjacent to the white point.
Display Rendering Errors
Modern digital displays suffer from a number of linear and nonlinear color rendering errors. This complicates the display profiling requirements, compared to those for more linear CRT displays of years gone by.
- Gamma Errors
- In monochrome images, gamma rendering errors result in non-uniform tone gradation, seen as tonal banding. Some tone steps are compressed and some are expanded, compared to accurate rendering. In color images, these gamma rendering errors result in both luminance errors and color errors as incorrect red, green, and blue luminance levels combine to create incorrect colors. This results in incorrect hue and incorrect saturation.
- Gamma errors are nonlinear display rendering errors.
- Color Crosstalk Errors
- In a direct view CRT or in a projector with three independent color beams (CRT, LCD, 3-chip DLP), the light output values of the three color primaries can always be controlled totally independently from each other. The three channels are said to be decoupled from each other.
- LCD and plasma flat panel displays, however, exhibit significant crosstalk between their red, green, and blue channels. One channel cannot be turned on or off without affecting the output of the other two channels. This causes the output level of one or both of the other two channels to vary as only one channel’s input level changes.
- We also see the effects of color crosstalk as we turn off one color input signal and still see some of that color remaining in the display output. This color crosstalk produces grayscale errors and color errors in rendered color images.
- Color crosstalk errors are nonlinear display rendering errors
- Color Decoding Errors
- RGB monitors that don’t provide Color or Tint/Hue controls have a fairly straightforward signal processing path. Each of the three RGB input signals are independently amplified from the display input connector to the RGB imaging device (i.e. CRT, LCD panel, etc.). An RGB monitor normally has some gamma and color crosstalk errors, as mentioned above.
- For video displays that provide Color and Tint controls, however, the signal processing path is more complex. The input signals to a video display are typically YCrCb-encoded luminance and color difference signals. Or, if RGB signals are applied, at some point in the signal path the RGB signals are mixed together (matrixed) to produce YCrCb signals.
- The display’s Color and Tint controls then act on the YCrCb signals to adjust the gain and amplitude relationship of the Cr and Cb signals. The YCrCb signals are then matrixed (decoded) to convert them back to RGB signals, for application to the display’s RGB imaging device. This additional color signal decoding brings with it the potential for color processing errors.
- Color decoding errors are nonlinear display rendering errors.
- Color Gamut Errors
- The native color gamut of most displays differs significantly from the desired color gamut (e.g. Rec.709, Adobe RGB). This is due to the intensity, saturation, or hue of one or more of the display’s color primaries differing from that of the color gamut standard to which the input signals were created.
- Color Gamut errors are linear display rendering errors.
Error Correction Methods
Of the above types of display rendering errors, only color gamut errors are linear. Gamma, color crosstalk, and color decoding errors are all nonlinear errors. Unlike legacy CRT displays, modern RGB monitors and video displays exhibit significant nonlinear rendering errors as well as linear errors. Four main methods have been developed to correct these display rendering errors.
1D LUT – Gamma and Grayscale Correction
A one-dimensional lookup table of correction data can be placed in the video signal path at a display’s input to correct the display’s gamma and grayscale (white balance) rendering errors. For a computer- connected display, this data is usually loaded into the video card gamma table (VCGT). With an 8-bit RGB signal, there are 256 points along the internal grayscale line (1024 points for 10-bit) (Figure 3).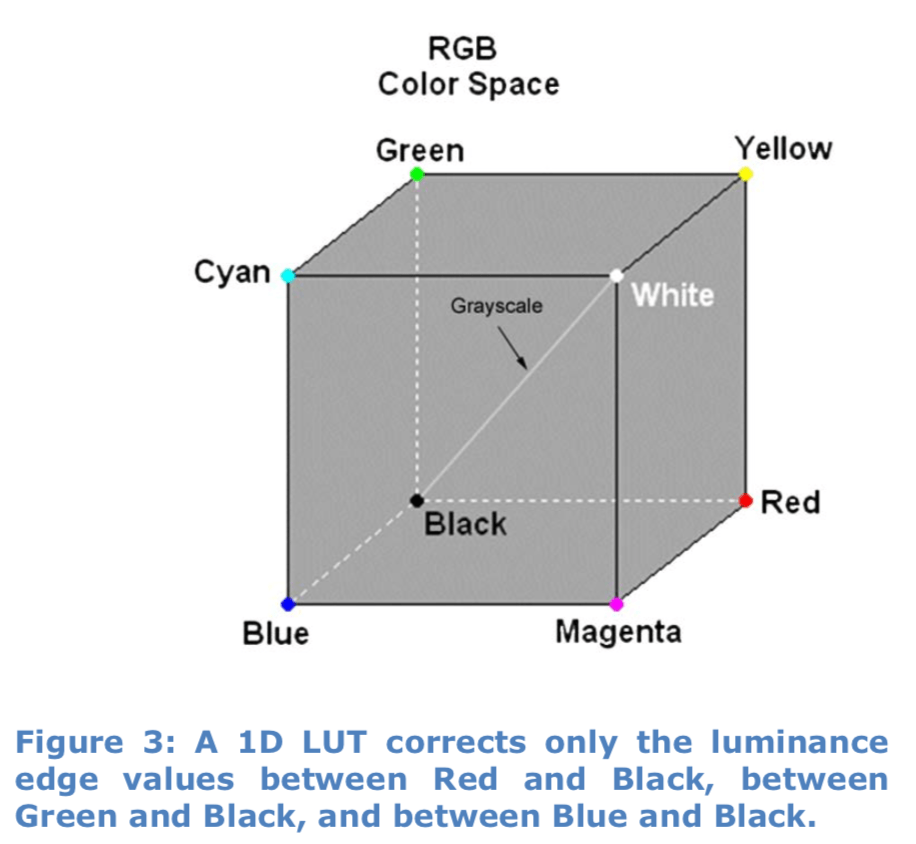
For every input signal grayscale value (e.g. R=146, G=146, B=146), the 1D lookup table produces a replacement output signal (e.g. R=142, G=147, B=153) to correct the display’s gamma and grayscale inaccuracies. Because every grayscale value is corrected, without interpolation, nonlinear gamma errors are corrected.
A 1D LUT is the underlying method used to implement multipoint gamma and grayscale controls in video displays.
1D LUT Capabilities:
- Corrects nonlinear gamma errors.
- Corrects white point and grayscale tracking errors.
- No interpolation. A corrected output luminance value is provided for every input luminance value for each of the red, green, and blue signal channels.
1D LUT Limitations
- Does not correct RGB crosstalk errors.
- Does not correct color gamut errors.
- Cannot correct color saturation without affecting contrast or brightness.
Color Matrix – Color Gamut Correction
Fully saturated primary colors define the outside edges of a display’s three-dimensional color space. A math matrix of color correction data (Figure 4) can be applied to the video signal path at a display’s input.
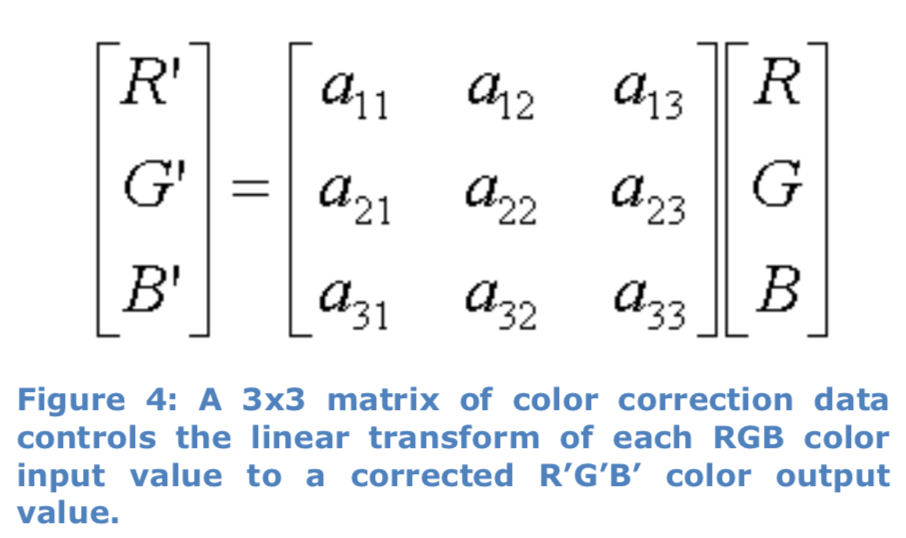
This matrix can correct luminance and chromaticity inaccuracies in the fully saturated primary colors that the display produces, compared to the desired standard colors. This is the underlying method used to implement standard CMS controls in video displays.
The display’s signal processor uses the data in the color correction matrix to perform a linear color transform on each pixel in the incoming signal. The supplied correction data are applied to fully saturated primary colors, and linear interpolated correction data are applied to all other colors.
Since a color matrix produces linear calculated correction data, nonlinear luminance and chromaticity errors in less than fully saturated colors are not corrected.
Color Matrix capabilities:
- Corrects linear color gamut luminance errors.
- Corrects linear color gamut chromaticity errors.
Color Matrix limitations:
- Does not correct nonlinear color gamut errors.
- Does not correct nonlinear RGB crosstalk errors.
- Does not correct nonlinear color decoding errors.
ICC Profile
In 1993, eight imaging industry vendors established the International Color Consortium (ICC) to create a standardized cross-platform Color Management System for computer RGB monitors. The consortium specified device profiles that a Color Matching Module (CMM) engine uses to translate color data created on one device into another device’s native color space.
An ICC profile characterizes the native color response of the associated input or output device. A display’s ICC Profile characterizes how the display renders signal input values to light output values.
An input profile can be associated with each image source device (cameras, scanners, etc.) and a display profile can be associated with each image display device. The ICC-specified CMM uses the response data in a source profile to translate color data from that source to an intermediate Profile Connection Space (PCS).
The CMM rendering module then translates the color data from the intermediate Profile Connection Space to a display’s native color space, using the response data in the display profile. This allows images from different profiled source devices to be more accurately rendered on each different profiled display device.
The default correction output data that an ICC CMM renders is a 1D LUT and a linear color matrix. Although ICC v4 also supports 3D LUT output data, that option is seldom used.
ICC Profile Capabilities
- Corrects nonlinear gamma errors with a 1D LUT that is loaded into the video card gamma table (VCGT).
- Corrects linear color gamut errors with a color matrix.
ICC Profile limitations:
- Does not validate display correction data created by the ICC CMS rendering engine.
- Does not correct nonlinear RGB crosstalk errors.
- Does not correct nonlinear color decoding errors.
The linear model of 1D LUT and color matrix correction employed with most ICC profiles is not capable of correcting the nonlinear color errors inherent in most flat panel displays.
3D LUT – Total Color Space Correction
Rather than use a 1D LUT to correct a display’s grayscale and a color matrix to correct linear color gamut errors, a three-dimensional lookup table of correction data can correct all the display’s colors.
A corrected output RGB triplet value could be provided for each input RGB triplet value for each of the colors in the display’s 3D color space (16.78 million colors in an 8-bit system or 1.07 billion colors in a 10-bit system). A full set of 256 or 1024 correction values for each RGB color channel would precisely correct every possible color in a display’s color space (figure 5).
Because a full set of 16.78 million or 1.07 billion correction values would be excessively large and difficult to implement, however, 3D lookup tables normally contain only 17, 33, or 65 correction values for each color channel (e.g. 17x17x17=4,913 values). A correction data renderer in the LUT processor then performs linear interpolation to derive the intermediate correction values.
3D LUT capabilities:
- Corrects nonlinear gamma errors.
- Corrects white point and grayscale tracking errors.
- Corrects RGB crosstalk errors.
- Corrects color gamut errors.
- Independently corrects color saturation, contrast, and brightness.
- Easy to create and use with modern tools
3D LUT limitations:
- Sensitive to display nonlinearities. A 3D LUT does not contain a full set of 256 or 1024 correction values for each color channel. To effectively correct linearity errors, either a large number of display colors (greater than 17x17x17) must be measured to create correction values, or each of the nonlinear areas of a display’s color space needs to be specifically targeted with additional color measurement points.
Note: Besides being used for display profiling or calibration, 3D LUTs are also used to convert between different color spaces (e.g. Adobe RGB to BT.709) and to provide different creative “looks.”
Modern digital displays have nonlinear errors that are not well corrected without the complex correction abilities of 3D LUTs.
Nonlinear gamma errors and linear color gamut errors can be corrected either with a linear color matrix or with a 3D LUT. However, nonlinear color gamut, color crosstalk, and color processing errors require the complex correction of a 3D LUT.
Creating 3D LUTs
A number of methods have been developed for collecting display performance information and creating a 3D lookup table of correction values for the display. These methods, often called display profiling, consist of measuring a large number of color points produced by a display, to characterize the display’s native color response.
The measured profile data only characterizes the display’s native color response; it is not correction or calibration data. The profile data documents that the display natively produces certain light output color values when presented with particular signal input values.
The profile data is then processed in a 3D LUT targeting engine to create correction data that is aimed at a selected set of color space targets (e.g. BT.1886, D65, Rec.709). The resulting 3D LUT data, at the selected LUT resolution (e.g. 65x65x65 points), corrects the display’s luminance and color rendering performance throughout its three-dimensional color space.
The various methods of creating 3D LUT correction data differ in their ease of use, the efficiency of their process, and their linearity correction accuracy.
Static Profiling Method
The earliest method of creating 3D LUT correction data is a static process of profiling a display’s performance throughout its color gamut with a predetermined set of color measurements. These measurements are performed at evenly spaced grid points throughout the RGB signal cube (figure 6).
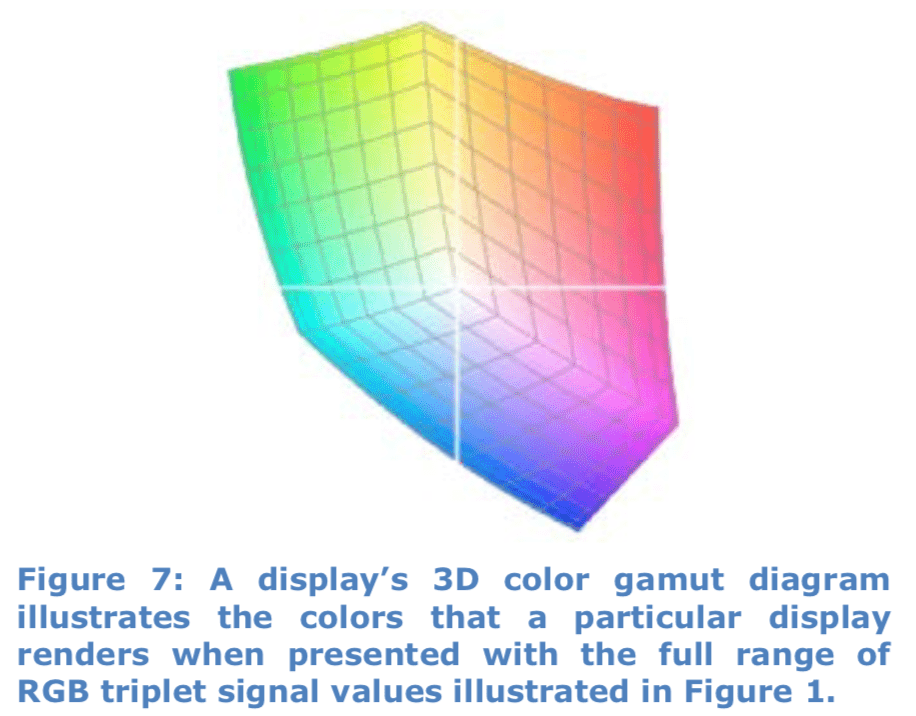
A commonly used grid size is 17x17x17, with 17 levels each of red, green, and blue being added together in all combinations to create 4,913 test colors. This array of test colors is distributed throughout a display’s three-dimensional color gamut (figure 7).
In static profiling, the predetermined test colors are rendered on a display under test and measured with a color meter. The measured values are then compared to the target values for those colors, to develop correction values for each of the color points. The data is saved to a lookup table as a three-dimensional array of color correction data for the tested display.
This display characterization method is static in that the test colors are predetermined, without dynamically adding test colors during the process to areas of a display’s gamut that are found to be nonlinear, needing more detailed error correction data.
In more recent days, it has been determined that 17x17x17 (4,913) fixed-grid color measurement points are often insufficient to correct the nonlinearities exhibited by modern displays. It has been found that the static profiling process often needs to measure at least 21x21x21 (9,261) color points to provide a desired level of display linearity correction.
The major problem with static 3D LUT profiling systems is that they measure a static set of profile points. This places more points than are needed in linear areas of a display’s color gamut and not enough points in the nonlinear areas. This allows any display nonlinearities to skew the accuracy of the calculated and linear interpolated LUT data.
Iterative Calibration Method
A later method of creating 3D LUT correction data was developed that produced optimized correction values for each selected test color. This was an iterative process, where each color was measured, then immediately corrected and measured again to detect nonlinear corrective effects, until the optimum correction value was determined for each color point.
Because optimum linearity correction values were immediately developed for each measured color point, each point could then serve as a perfect linear anchor for interpolating correction values for the surrounding non-measured color points. This efficient iterative method of optimizing color anchor points allowed fewer color points to be measured and still achieve a desired final accuracy of linearity correction.
Dynamic Linearity Correction™
A later enhancement to the iterative calibration method, called Dynamic Linearity Correction™ (DLC), automatically added color optimization points in those areas of a display’s color gamut that were found to have the greatest linearity errors. After an initial set of color points was optimized (mostly at the outside surfaces of the color gamut), linear interpolation was performed to predict what colors would be produced from the remaining RGB signal values in a perfectly linear display.
As the remaining color points were then measured and optimized, the DLC function compared each point’s initial measured value to its predicted linear value, to determine the amount of display nonlinearity at each color point. At color points that exceeded a selected error threshold, extra color optimization points were added in that nonlinear area of the color gamut.
This dynamic process was repeated with the added color points, automatically adding more points outward until the boundaries of each nonlinear gamut area were just reached, totally optimizing each of the display’s nonlinear color areas to the selected level of accuracy.
The DLC function allowed a majority of the display calibration points to be allocated to the display’s nonlinear color gamut areas. Thus, Dynamic Linearity Correction further increased the efficiency of the iterative calibration method, producing greater overall display accuracy for a given number of profiled color points.
Calman Dynamic Profiling™
Calman’s Dynamic Profiling 3D LUT display calibration system includes a new display profiling and 3D LUT targeting engine, first available in Calman version 5.4.0. The new calibration engine makes it easier than ever to create a corrective 3D LUT for a display. There are four functional components of the new profiling and targeting engine:
- Intelligent Resolution Profiling™
- Lightning LUT
- 3D LUT Targeting
- 3D LUT Retargeting
Previous static profiling methods took six to ten hours to accurately profile a display, which was inconvenient and error-prone. Calman’s Intelligent Resolution Profiling creates an extremely accurate profile in just two to three hours, for very nonlinear displays. And, for displays with moderate linearity, Calman’s Lightning LUT process creates an accurate profile in just five minutes.
The 3D LUT targeting engine also enables 3D LUT retargeting to a new color space target from an existing display profile, in just a couple of minutes.
Intelligent Resolution Profiling™
This newest method of collecting display performance information and creating a 3D lookup table of correction values combines the legacy method of static display profile measurements with the proven Dynamic Linearity Correction algorithm that was previously developed and used with iterative calibration.
Intelligent Resolution Profiling (IRPTM) provides two important benefits over previous 3D LUT creation methods.
- Higher calibration efficiency
- The new IRP 3D LUT process requires fewer color measurements than any previous method to achieve a desired level of display calibration accuracy. Typically only 2,000-3,000 measurement points are required to create an extremely accurate display profile, taking only two to three hours.
The key to this efficiency is that DLC strategically locates most of the measurement points in nonlinear areas of the display’s color space that couldn’t otherwise be accurately interpolated.
- The new IRP 3D LUT process requires fewer color measurements than any previous method to achieve a desired level of display calibration accuracy. Typically only 2,000-3,000 measurement points are required to create an extremely accurate display profile, taking only two to three hours.
- Calibration flexibility and user-friendliness
- A user can select a time limit to devote to a 3D LUT calibration and the IRP process will create a display calibration with the highest accuracy possible within that selected time.When Calman initiates IRP, it first presents a setup dialog to the user to select a desired calibration completion time. Calman then measures about 400 display colors to define the structure of the display’s rendered color gamut; along the RGB signal cube edges, on the cube faces, and within the cube interior.
From these initial color measurements, the Calman Dynamic Linearity Correction algorithm uses linear interpolation to predict the colors that would be produced, by a perfectly linear display, from the next sample set of 300-400 RGB signal values. Calman then measures that set of color points and the DLC function compares each point’s measured value to its linear predicted value, to detect the degree of nonlinearity at each color point.
At color points that exceed a preset DLC error threshold, Calman then adds adjacent measurement points in that color area, repeating the process until each nonlinear area of the display’s gamut is fully sampled with measurement points.
Measurement Time Limit
From the initial measurements, Calman determines how long each measurement takes (driven by color meter and pattern source variables). From the first set of DLC sample colors, it also projects the total number of linearity correction points that would be dynamically added during a complete profile at the preset error threshold, if there were no time limit.
From the results of this initial sample set, DLC runs a heuristic analysis to evaluate the degree of linearity error that can be corrected within the selected time limit. Calman then automatically resets the DLC error threshold to the level that it has calculated will result in the achievable number of calibration points in the given time.
This automatic DLC threshold setting allows Calman to add measurement points in the most nonlinear areas of the display gamut, to take optimal advantage of the allocated measurement time.
The IRP process then proceeds to measure the remaining color points and create an optimized 3D table of display correction data. Calman writes the final set of color gamut error data to a profile log file, to a 3D LUT software output file, and to a hardware LUT device, if connected.
Intelligent Resolution ProfilingTM produces the highest accuracy conversion from the display’s native gamma and color gamut to the desired target gamma and gamut, given the available measurement time.
Lightning LUT
Calman’s new profiling and targeting engine includes the Lightning LUT profiling process. Lightning LUT produces a high-quality corrective LUT in five minutes or less for displays with at least moderate linearity, regardless of display technology. For a moderately linear display, Lightning LUT provides the ultimate efficiency.
The fast Lightning LUT profile measures just 65 to 73 color points along a display’s RGBW ramps, in less than five minutes, depending upon the luminance levels calibrated. The 3D LUT targeting engine then uses an innovative conversion matrix algorithm to exploit the full relational significance of the profile data at adjacent color points while creating a transform to the target color space.
Lightning LUT corrects gamma, grayscale balance, RGB crosstalk, moderate color saturation and luminance nonlinearities, and reduces wide gamut volume to a target volume. Lightning LUT rivals the accuracy of Calman’s previous 2,000 point DLC calibration, on displays with moderate linearity.
Note: For displays with higher linearity errors, Calman’s IRP process provides unmatched accuracy of display linearity correction, in as little as 30 minutes.
3D LUT Targeting
The Calman 3D LUT targeting engine accepts an arbitrary number of profiled color points from either the IRP™ or Lightning LUT process. The targeting engine uses superior nearest neighbor interpolation to accurately transform a lower resolution display profile to a higher resolution 3D LUT, at the target color space. The nearest neighbor formula gives excellent accuracy, with low artifacts and good gamut bounds resolution, when interpolating from the sparse grid IRP or Lightning profile to an ordered grid 3D LUT (5x5x5 up to 65x65x65).
3D LUT Retargeting
The Calman 3D LUT targeting engine also allows you to retarget a display profile to a new 3D LUT. This allows you to retarget the profile to a different color space, without performing additional display measurements. The targeting engine simply accesses the original saved profile data, re-computes the 3D LUT interpolation to the new color space, and writes a new LUT file. In just a couple of minutes, you can have a new LUT to retarget your display to a new color space.
Conclusion
Static display profiling, originally developed in the era of CRT displays, works very well to correct nonlinear gamma and linear color gamut display rendering errors. Modern digital displays still have those errors, but also exhibit nonlinear color rendering errors that CRT displays did not.
These nonlinear rendering errors are not well corrected with static display profiling systems and often create additional image artifacts during the targeting process to produce 3D LUT correction data. Modern displays require a more effective profiling method to correct their inherently nonlinear color rendering.
Calman’s Dynamic ProfilingTM 3D LUT display calibration system, now with a new display profiling and 3D LUT targeting engine, more effectively corrects display rendering errors than any other available system. Plus, the Dynamic Profiling system is now more efficient and user-friendly. You press a single AutoCube calibration button and come back shortly to a highly accurate, fully optimized 3D corrective LUT.
The new Intelligent Resolution Profiling (IRP) process allows a user to select a desired time window for creating a 3D LUT. IRP evaluates the degree of display error and automatically sets the error threshold for Dynamic Linearity Correction (DLC) for maximum effectiveness within the given time limit. The IRP process then uses DLC to allocate a majority of the profile points to the nonlinear areas of the display’s color space, to take optimal advantage of the allocated measurement time.
The new Lightning LUT process provides an even faster option for displays with at least moderate native linearity. Lightning LUT produces a high-quality corrective LUT in about five minutes for those displays, providing the ultimate calibration efficiency.
3D LUT Retargeting in the updated Dynamic Profiling system allows you to retarget your display to a new color space in just minutes, without performing additional display measurements.
The new display profiling and 3D LUT targeting engine in Calman’s Dynamic Profiling™system allows you to most efficiently and accurately correct a display’s linear and nonlinear color rendering errors, in less time and more easily than ever before.