A report on the use of Neutral Density (ND) filters to increase the dynamic range of display color calibrators
Summary:
The use of Neutral Density (ND) filters to extend the dynamic range of display color calibrators is NOT recommended.
Problem statement:
All color measurement devices used to calibrate display systems have an upper limit beyond which they do not measure accurately. The meter cannot be used to calibrate a display with a peak luminance that exceeds this saturation level.
Some users have suggested measuring the display through a Neutral Density (ND) filter to reduce the amount of light within the range that the meter can measure. For example, a meter with a range of up to 1,000 nits could be extended to measure sources to 10,000 nits by using a 1.0 ND filter that absorbs 90% of the light and transmits 10% (10,000 nits becomes 1,000 to the meter), and then correcting the measurements with an appropriate scale factor to compensate for the ND filter in the optical path. Doing this reduces the amount of light at the low end as well, so if the meter could measure down to 0.1 nits without the ND filter, it can only measure down to 1.0 nits with the filter in place. One solution is to measure darker colors without the ND filter and to measure brighter colors with the filter. Software is used to correct the “with filter” measurements by multiplying by the appropriate correction factor, which is 1/t , where t is the visual transmittance of the filter. In the case of the 1.0 ND filter, the correction factor would be 10 (1/0.1).
The problem with this method is that ND filters are neither 100% neutral (they add some color tint to the measurements) nor do they transmit exactly the fraction of light indicated by their labeled rating and may or may not have published specifications. In addition, these filters are subject to manufacturing variabilities. Any given filter may differ from the specified average values for the product. The departures from labeled and specified values are enough to introduce significant color measurement errors when assumed correction factors are applied. Worse, flipping the ND filter in for some colors and leaving it out for others produces a “break” or discontinuity in the measurements that results in breaks in the calibration curves or look-up tables producing color shifts and banding in images.
Example:
ND filters manufactured by different vendors use different technologies and chemistries, so they have different optical properties. The Wratten #96 1.0 ND filter is an industry standard and is used in this example. With filter specification data sourced from Kodak Photographic Filters Handbook, Eastman Kodak Company, 1990, it is possible to simulate measurements under a variety of conditions.
Using D65 as the reference light source, a display that is adjusted to the correct white point has CIE x, y coordinates of x = 0.313, y = 0.329 and L*a*b* color coordinates of (100, 0.0, 0.0). However, the Wratten #96 1.0 ND filter is not perfectly neutral and has a nominal transmittance of 12%, not the 10% indicated by the label. When the same patch is measured with the filter in place, the x, y coordinates are x = 0.322, y = 0.345 and the Y is 12%. The L*a*b* color coordinates are (41, -0.3, 3.8), which is a significant color shift in the yellow direction.
Without knowing the published specifications for the Wratten #96 filter one would apply a correction factor of 10x to the measured XYZ tristimulus values for the labeled 0.1 transmittance (1.0 Density) of the filter. We call this correction method A. Applying this correction factor results in xyY and L*a*b* coordinates of .0322, 0.345, 120% and (107.3, -.35, 8.2).
If the specified 12% transmittance factor is used to calculate the correction factor of 8.33x (1/0.12) an accurate measurement of luminance (Y) results, but there are still significant errors in chromaticity. We call this method B. Not all ND filters have published specifications, so method B cannot be used in all cases. The resulting colorimetric values are xyY of .0322, 0.345, 100%, and L*a*b* coordinates of (100. -2.9, 7.8).
Measurements with and without corrections of the D65 white point, as well as the deltas from the correct (no filter) measurement are shown in tables 1 and 2.
|
Condition |
x |
y |
Y |
delta x |
Delta y |
Y error |
|
No filter |
0.313 |
0.329 |
1.00 |
0.000 |
0.000 |
0.0% |
|
Filter no correction |
0.313 |
0.329 |
0.12 |
0.000 |
0.000 |
-88% |
|
Filter method A |
0.323 |
0.345 |
1.20 |
0.010 |
0.016 |
+20% |
|
Filter method B |
0.323 |
0.345 |
1.00 |
0.010 |
0.016 |
0.0% |
|
Condition |
L* |
a* |
b* |
delta a* |
Delta b* |
Delta L* |
Delta Eab |
|
No filter |
100 |
0.0 |
0.0 |
0.0 |
0.0 |
0.0 |
0.0 |
|
Filter no correction |
41.2 |
-0.3 |
3.8 |
-0.3 |
3.8 |
-58.8 |
58.9 |
|
Filter method A |
107.3 |
-3.5 |
8.2 |
-3.5 |
8.2 |
7.3 |
11.5 |
|
Filter method B |
100 |
-2.9 |
7.8 |
-2.9 |
7.8 |
0.0 |
8.3 |
As shown in table 2, measured color errors are very significant, even when the specified characteristics of the filter are considered using method B (delta E of 8.3).
Even more problematic than absolute measurement errors are the “breaks” in the measurement curves (EOTF) that result when the filter is included for some patches and removed for others. This is shown in figure 1 (below), which shows the XYZ measurement of a gray scale for a gamma 2.2 monitor with a D65 white point. For this example, the ND filter is used and corrected using method B for gray values greater than 80 IRE (204 out of 255 for an 8-bit system) and no filter is used for colors below this level.
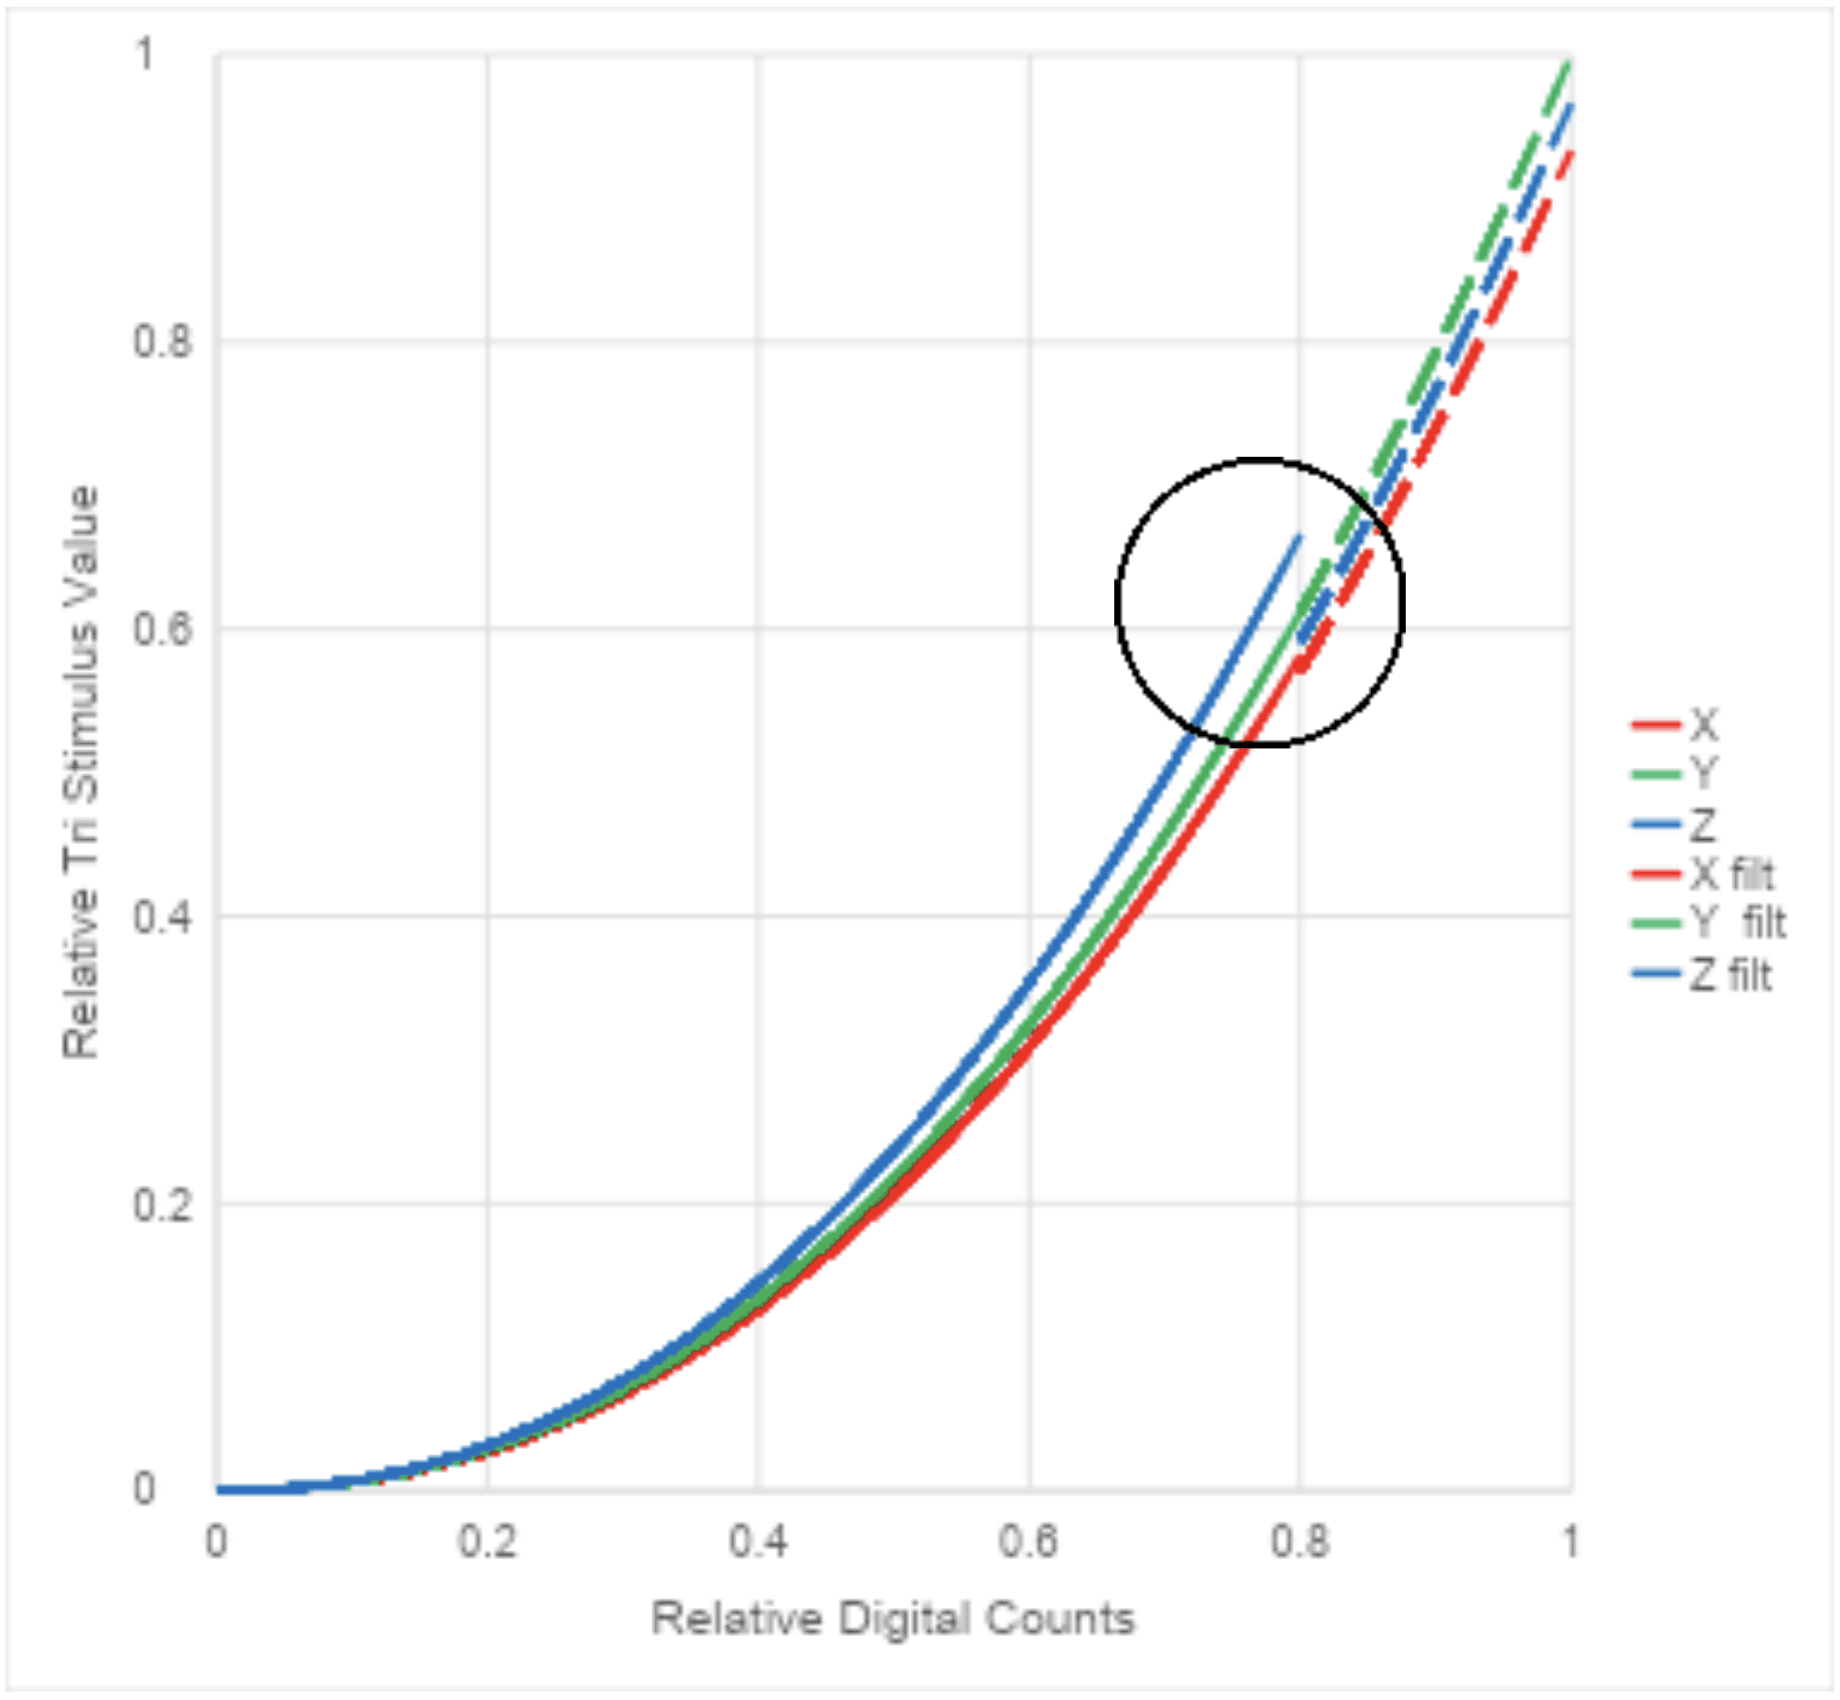
In figure 1, notice the severe breaks, or discontinuities, in the X and Z measurements at 80% IRE (the circled region). This causes corresponding “breaks” in the correction curves and even reversals that result in artifacts in images on the screen. If the actual transmittance of the filter is even a little different from the specified value, corresponding anomalies would appear in the Y curve as well.
Visual effects that color scientists call “Mach Bands” cause severe visual banding in smooth tones such as face tones, even with very minor departures from smoothness of the measured curves.
It is possible to devise more complex and multidimensional methods to correct the “with filter” data to match the “without filter” data more closely. But they will almost certainly result in at least minor breaks in the curves where measurements made under two different conditions are “knitted together.” These methods are also difficult for most users to implement correctly because they must:
- Identify which colors need to be measured with and without the filter in advance
- Indicate to the software which are which so the software can know when to apply the corrections and when not
- Supply accurate information to the software about the actual optical properties of the filters
- Provide a method to attach the filter to the colorimeter that is repeatable
Some other factors that can influence the accuracy of the corrections and the severity of breaks in the measured curves:
- Filters age with time and use – their calibration factors may shift
- Filters can become dirty and contaminated with use and that can affect their transmission properties
- Some filters are sensitive to temperature
- The effective transmission of the filter depends on its angle and position in the colorimeter’s optical path
- Because filters scatter light as well as absorb it, the effective transmission of the filter can depend on the colorimeter’s collection angle
Conclusion
Color measurement and the construction and calibration of colorimeters combine advanced science and engineering with careful factory process control. Even seemingly simple measurement devices are complex systems that depend on the appropriate configuration of optics, mechanics, electronics, and driver software to produce the correct results. Very subtle effects can affect measurement accuracy and, more importantly, the smoothness of the resulting measured tone scales. Color measurement instruments must be used without modification to the optical, electrical, and software configurations under which they were manufactured and calibrated.