Introduction
Before display calibration, It’s important to understand how a display behaves. Not all displays can be treated with a one-size-fits-all calibration solution. Some displays exhibit specific characteristics that don’t follow traditional display color physics. This could be due to the manufacturing of the panel itself or processing within the video pipeline. In this instance, more device characterization must occur to achieve an accurate calibration. This usually means that more measurements must be taken of the display before calibration, as the display behavior throughout the color volume is unknown and not predictable with a small dataset.
The most common issues encountered on display devices are those that exhibit non-additive characteristics. A display is considered “non-additive” when the energy output of its primary color components measured individually does not sum together to equal the same energy output of color combinations. For example, the peak primaries do not sum to peak white, or the combination of red and green does not equal yellow.
This behavior is represented in Equations 1, and 2, for white.
- Equation 1
-
- XYZR + XYZG + XYZB ≠ XYZRGB
-
- Equation 2
- XYZ(R,0,0) + XYZ(0,G,0) + XYZ(0,0,B) ≠ XYZ(R,G,B)
Utilization
Calman’s display additivity feature lets display partners, reviewers, and calibrators alike identify how predictable a display device is for outer and inner gamut color reproduction. This information is key for quantifying calibration quality, comparing technologies, identifying problems, or evaluating settings before calibrating a display.
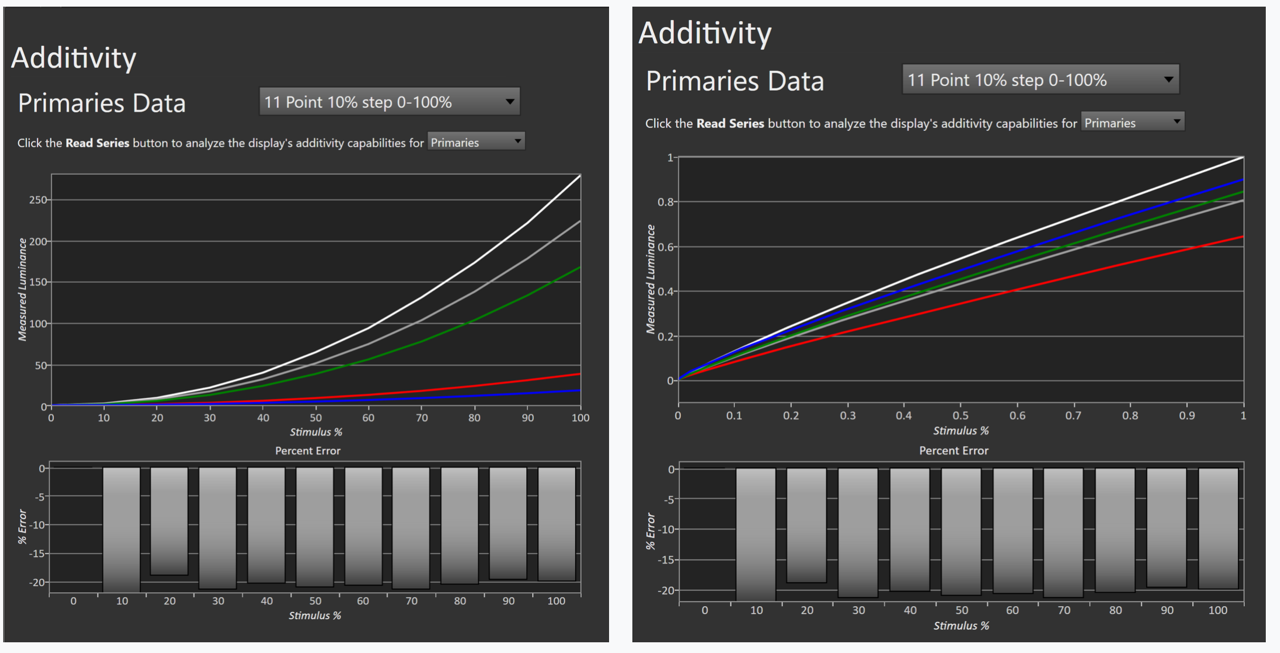
The first and easiest test for additivity is to check the grayscale, primary, and secondary characteristics of a display using the SDR or HDR toolkit and selecting the Additivity layout page. The output luminance of the grayscale ramp should equal the sum of the output luminance of red, green, and blue individually. The same is true for the relationship between primaries and secondaries (green + blue = cyan, red + blue = magenta, red + green = yellow). The panel is considered “non-additive” when these relationships are not true. In this instance, “Matrix LUT” and “Lightning LUT” calibration types for 3DLUTs will likely not achieve good calibration results, and a “Fixed LUT” option is recommended. An additive display will have a percent error that is a straight line at 0%, otherwise, the percent error will deviate from this nominal value.
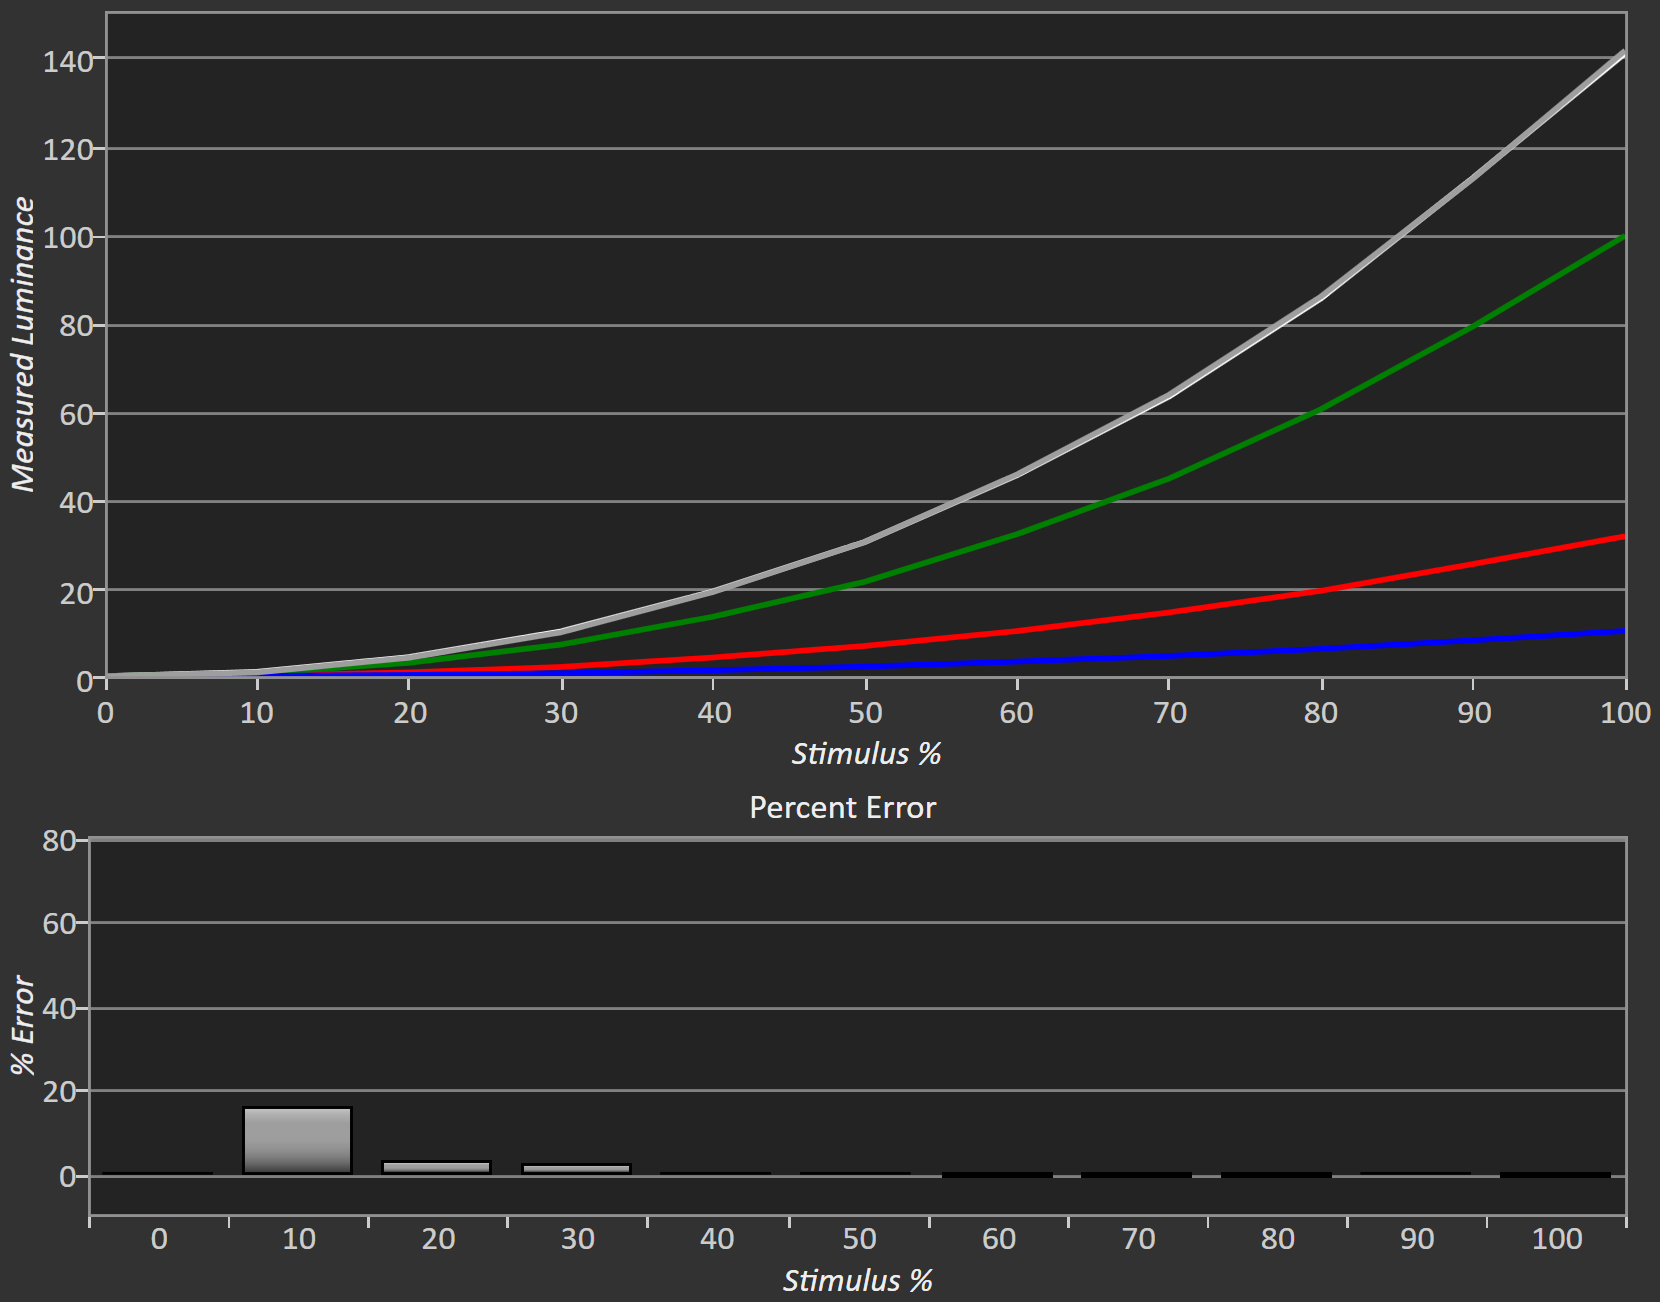
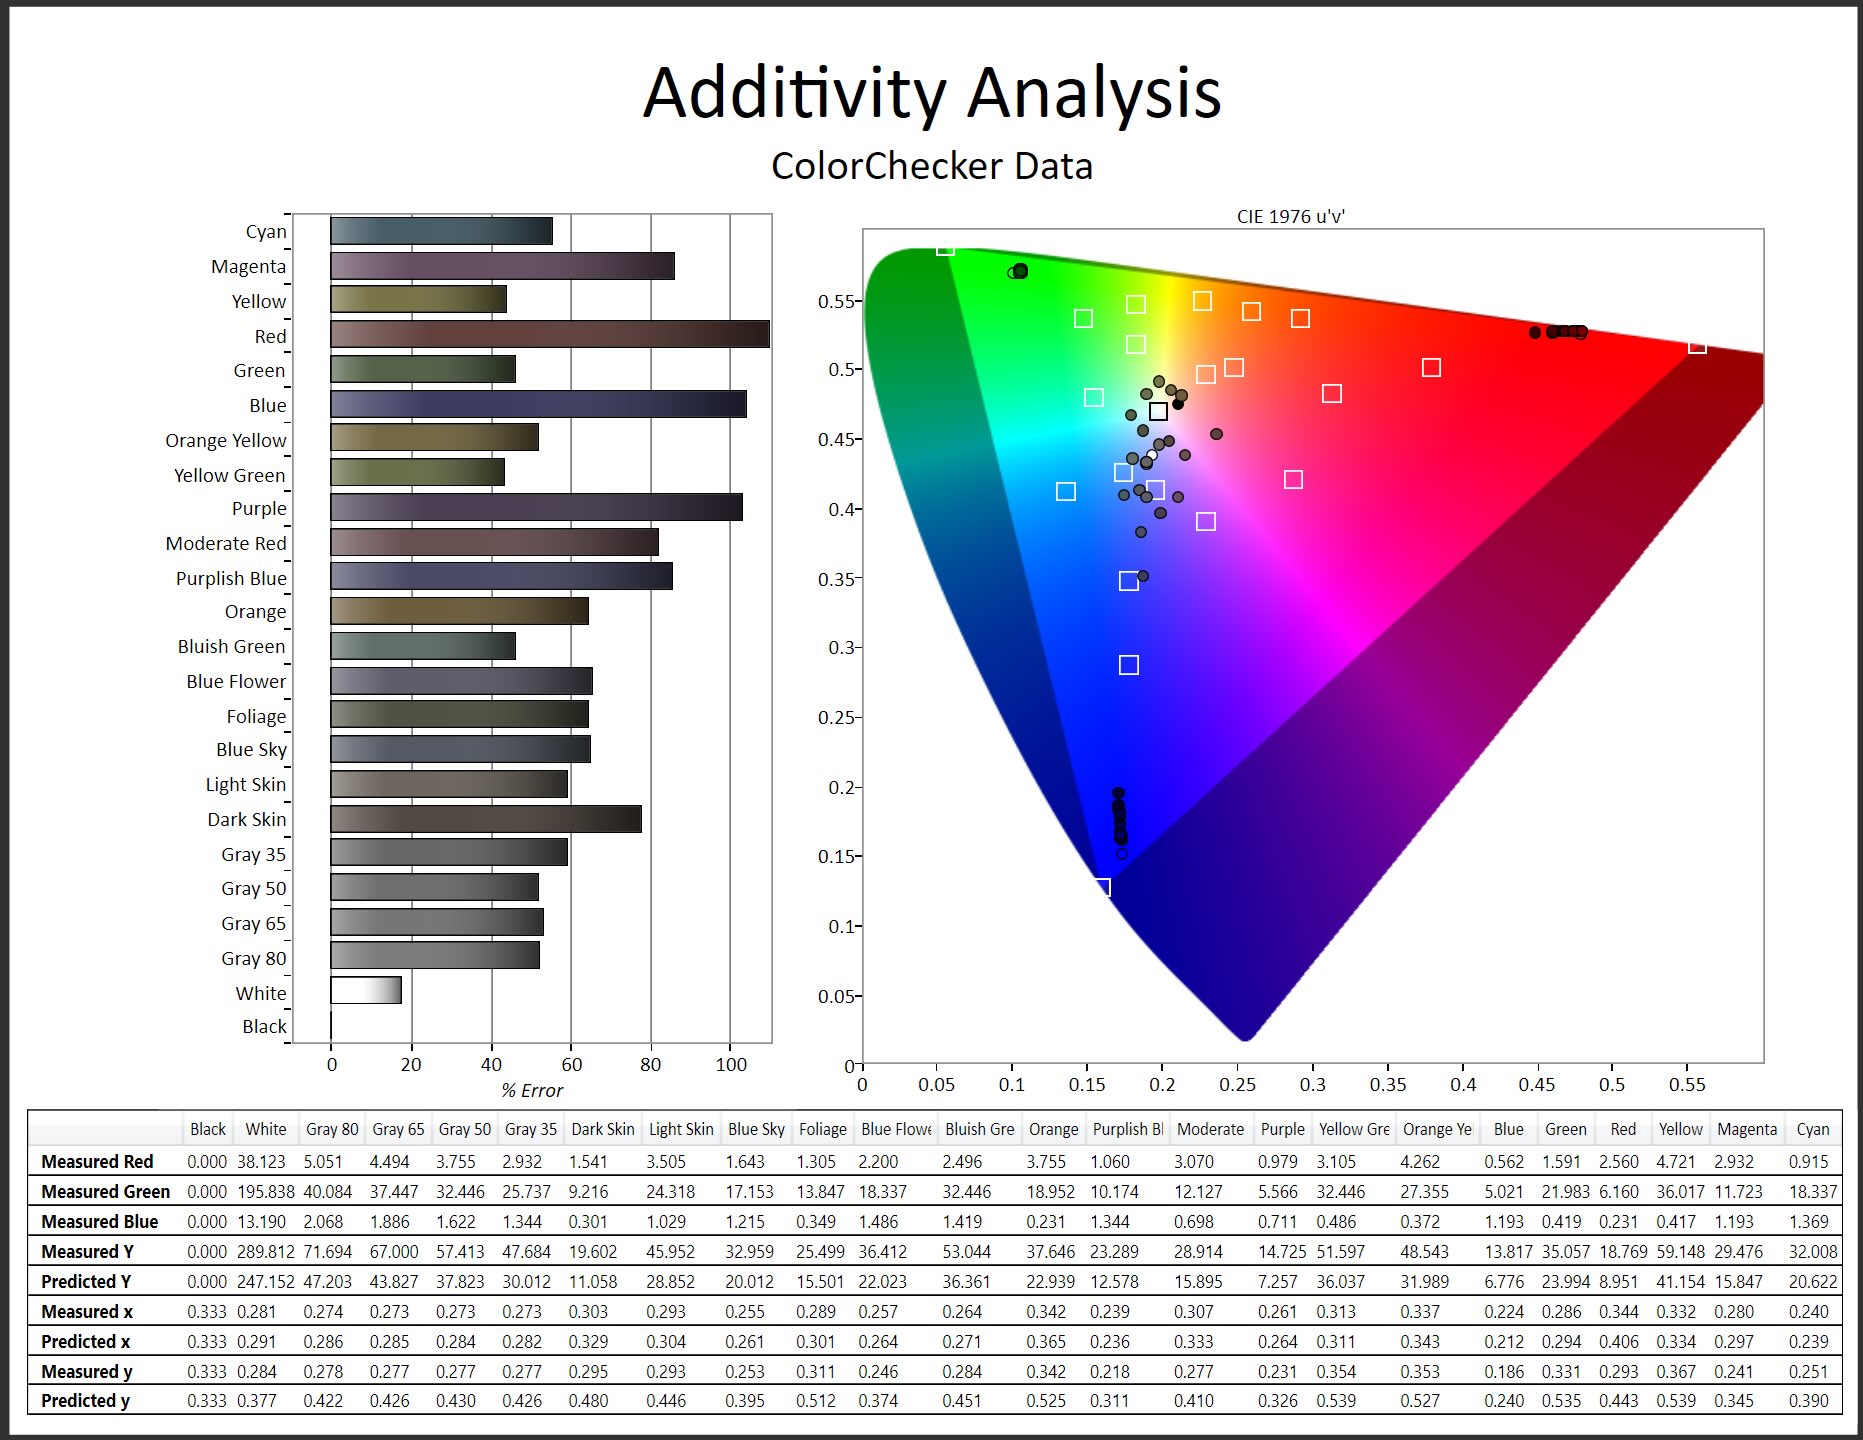
Similar analyses can be performed using the ColorChecker patches with the additional measurement of their primary components so that individual primaries are summed together and compared against the true measured values.
SDR and HDR Toolkit
An additivity layout page is available to users with a Calman Ultimate, Video Pro, or Studio license in Calman’s analysis suite under the SDR & HDR toolkits for ease of use. Access the layout page directly by clicking the “Additivity button” on the welcome page or select “Additivity” after opening up the left Workflow Panel with the top-left arrow button. Calman Ultimate users can also design custom workflows with the new Additivity elements.
To read more about “Design Mode” in Calman Ultimate, click here
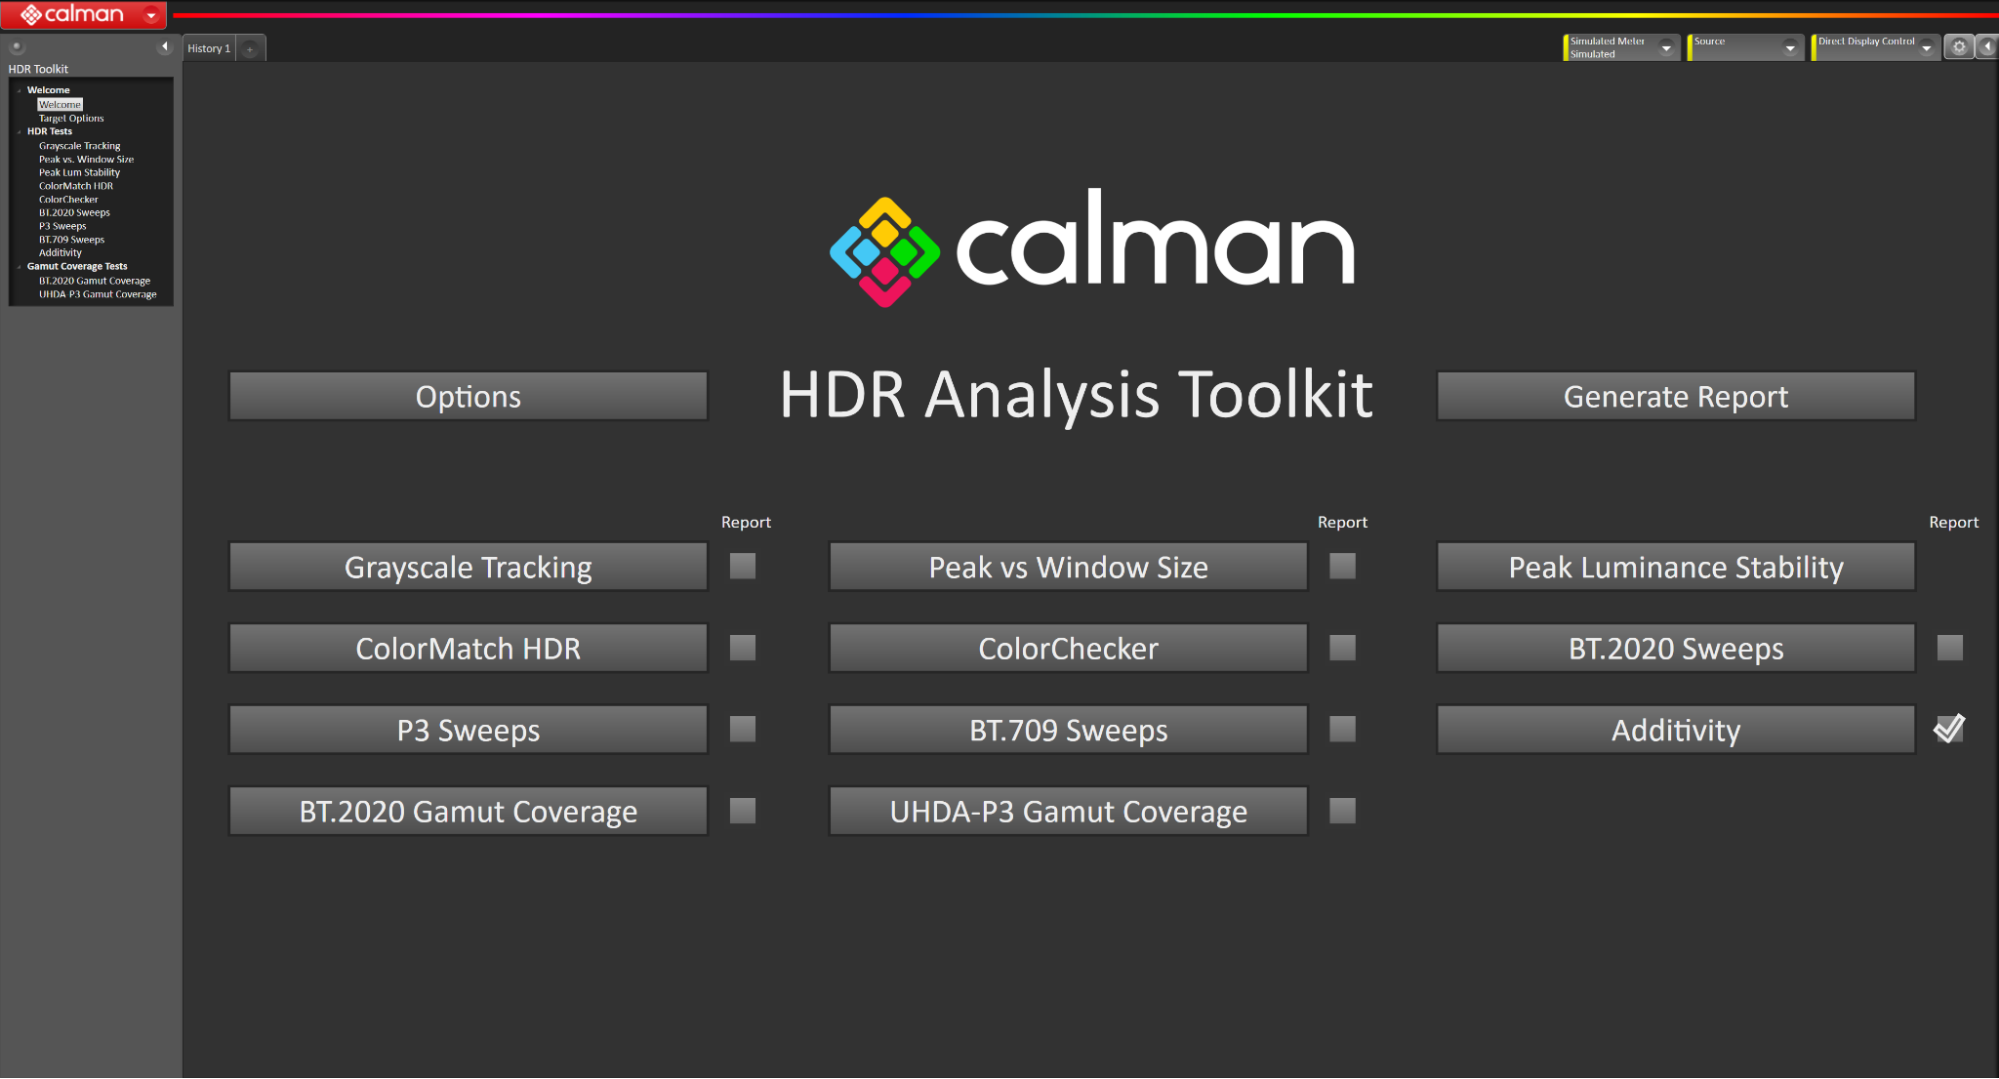
A checkbox is located right next to the Additivity button. Select to include additivity data to your report
Additivity Layout Page
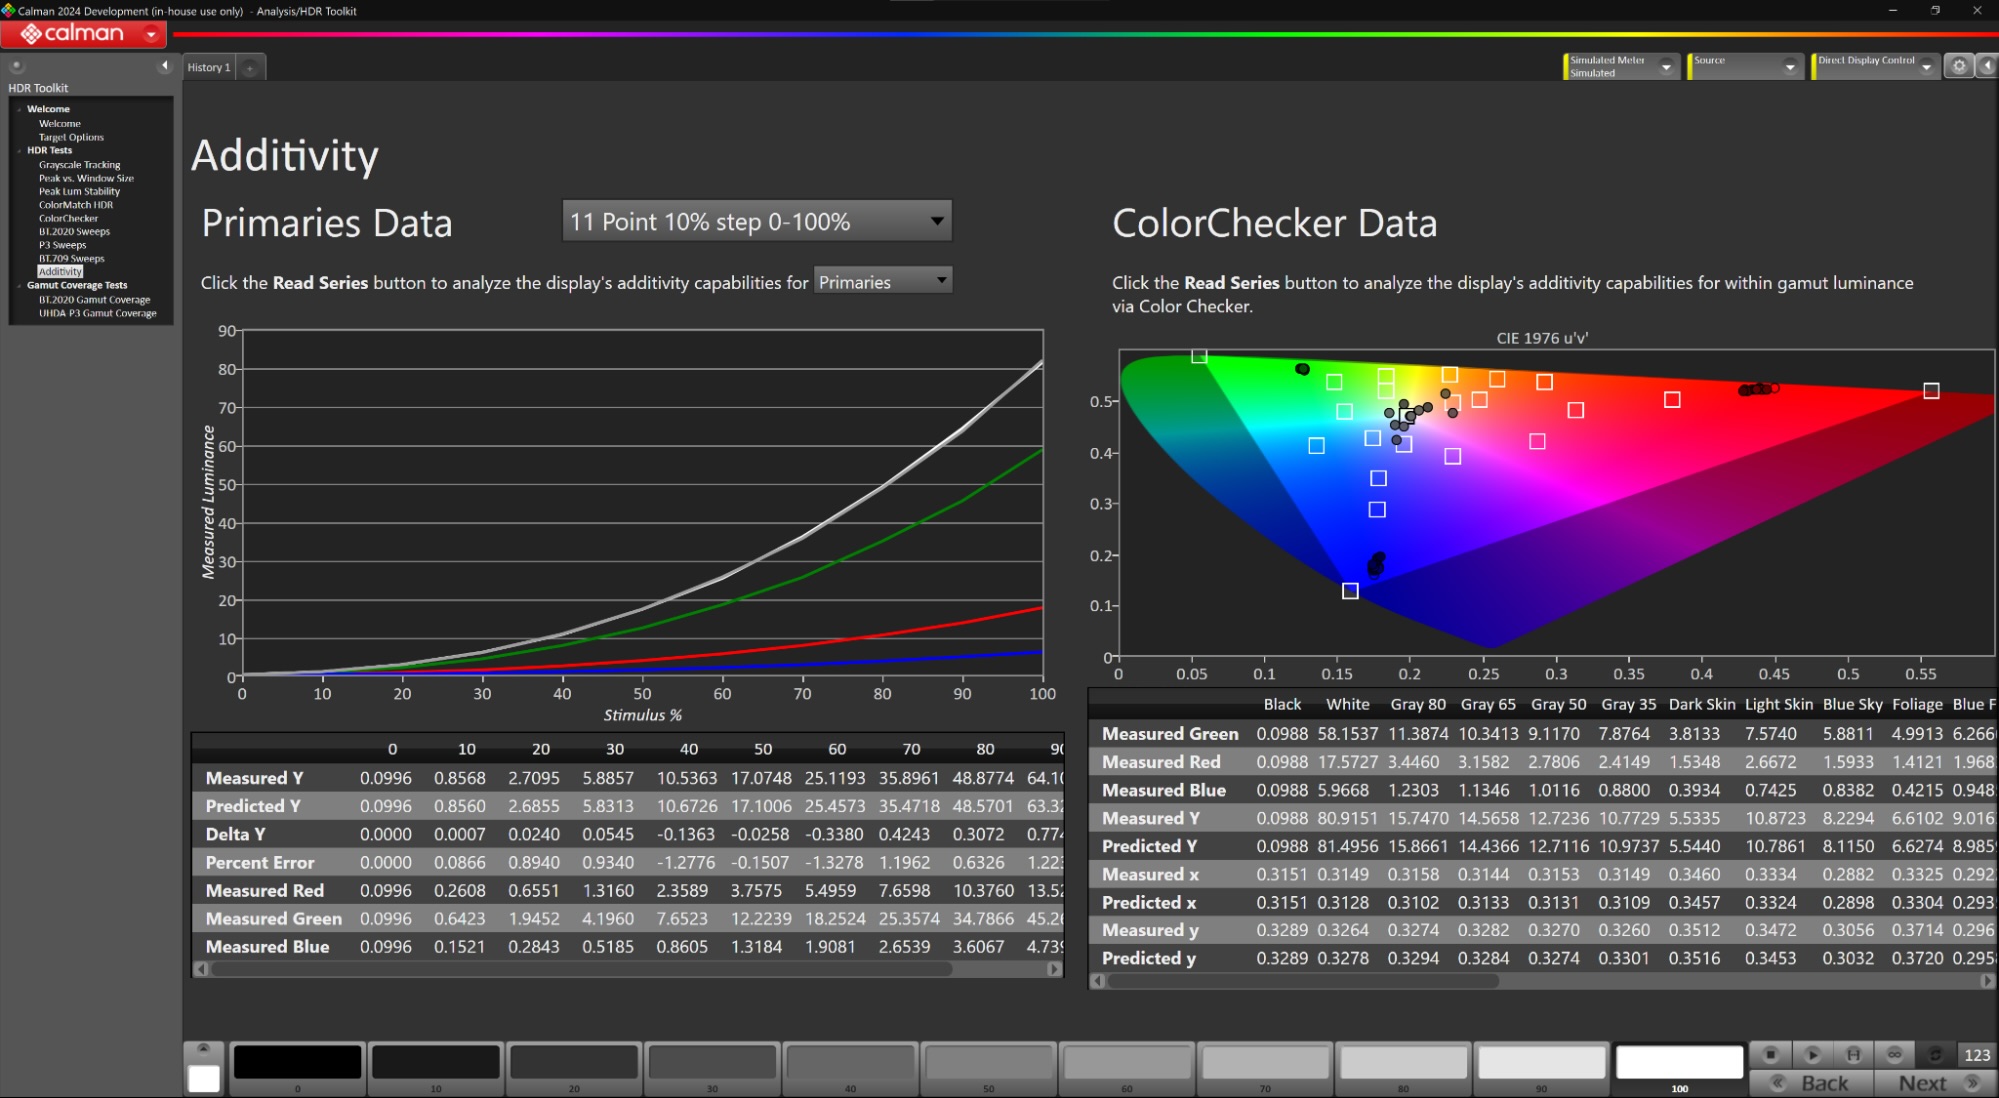
The “Additivity layout” page consists of two analysis sections: Primaries and secondaries to the left side, and color checker colors to the right.
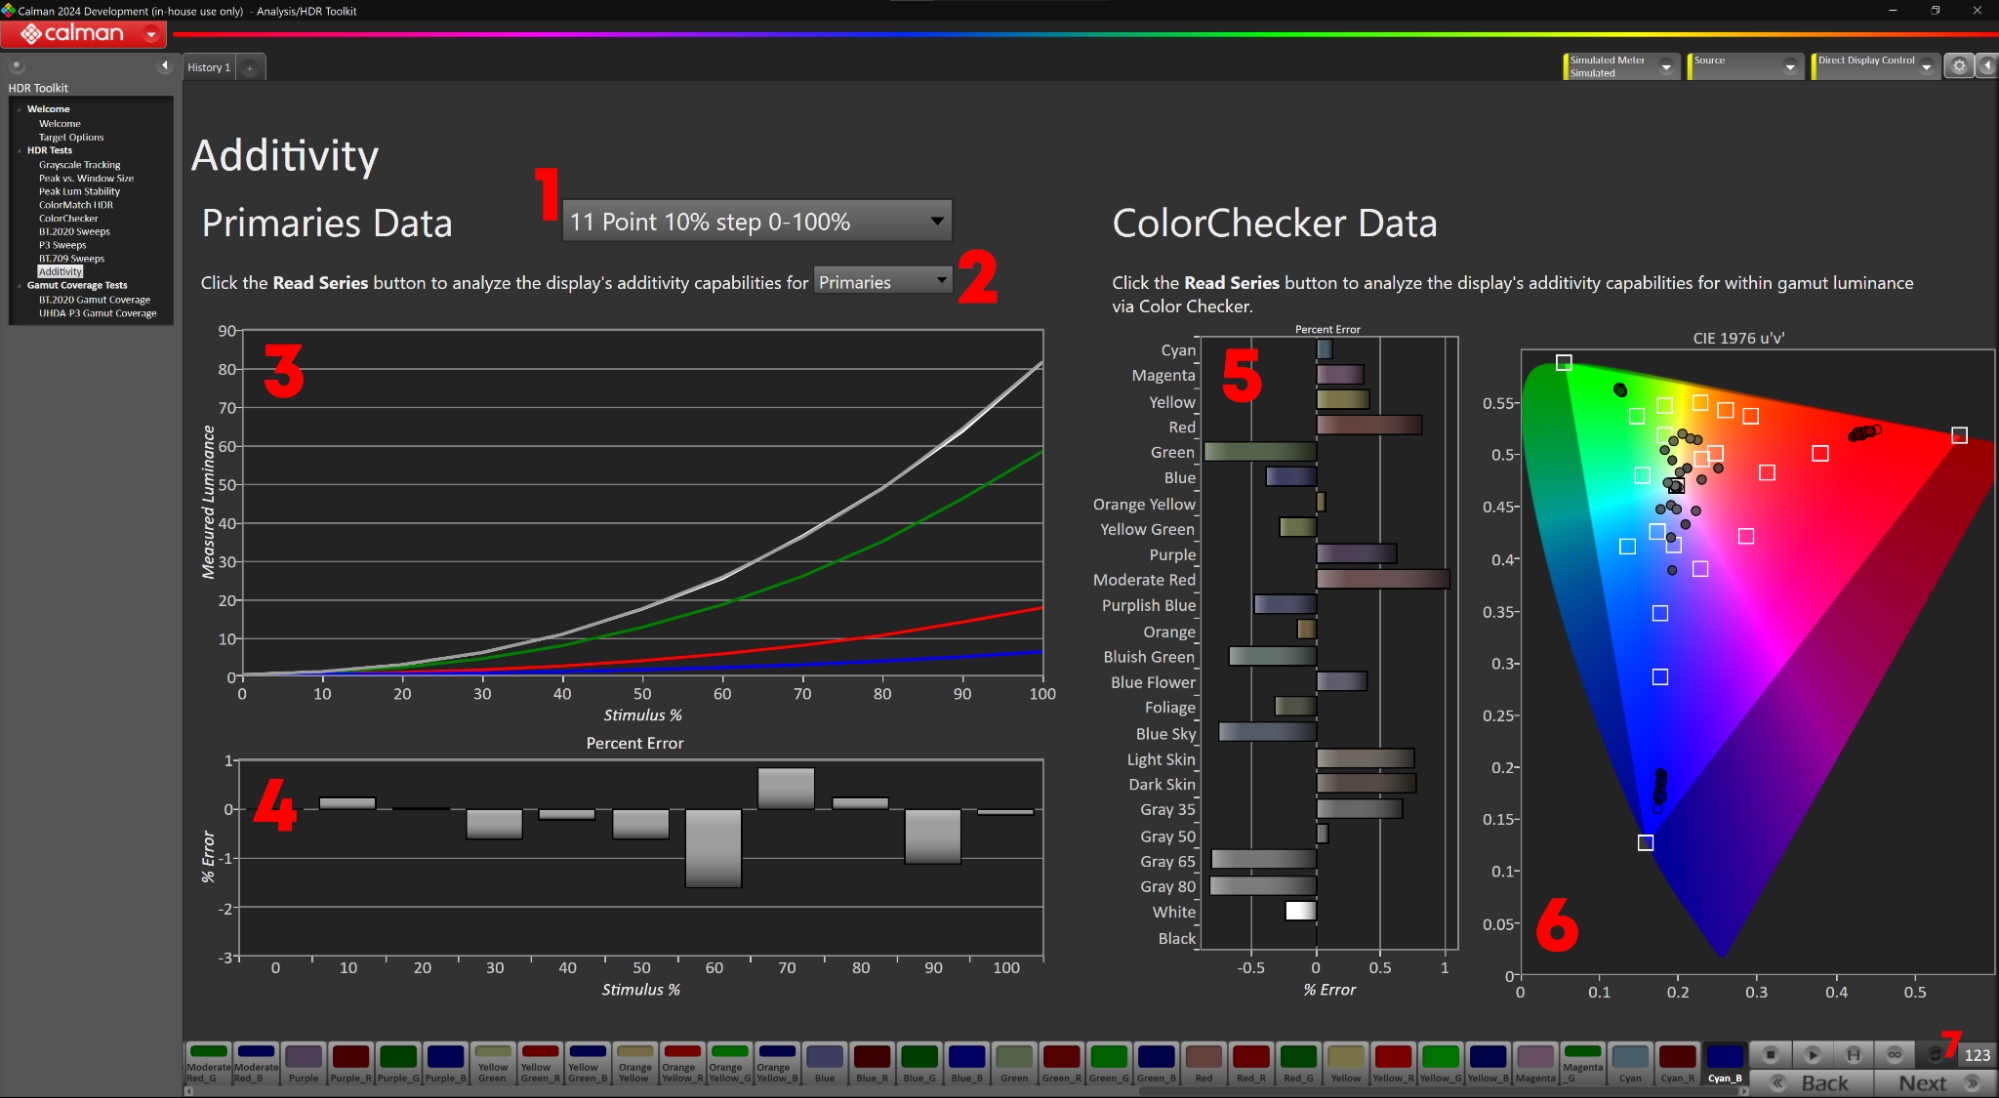
- Luminance ramp points drop-down to select number of points for RGB, R, G, B, C, M, Y comparison
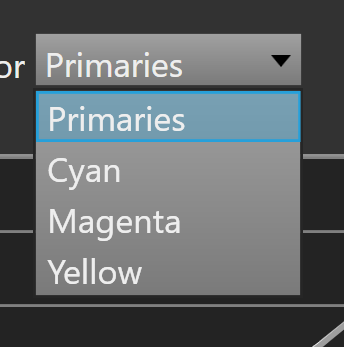
- Additivity chart type drop-down to select graph view between Primaries, Cyan, Magenta, or Yellow
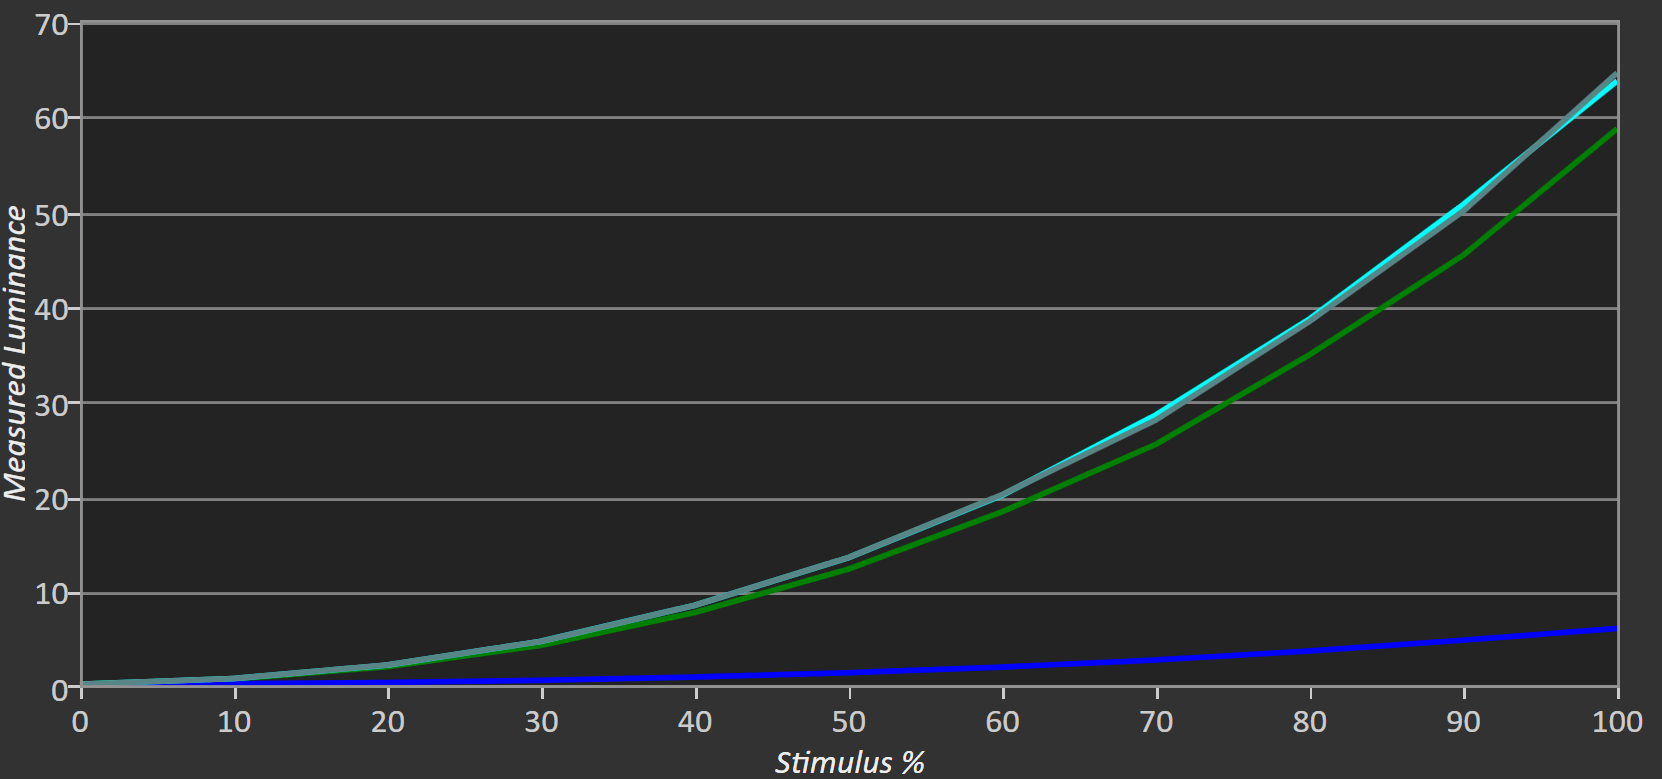
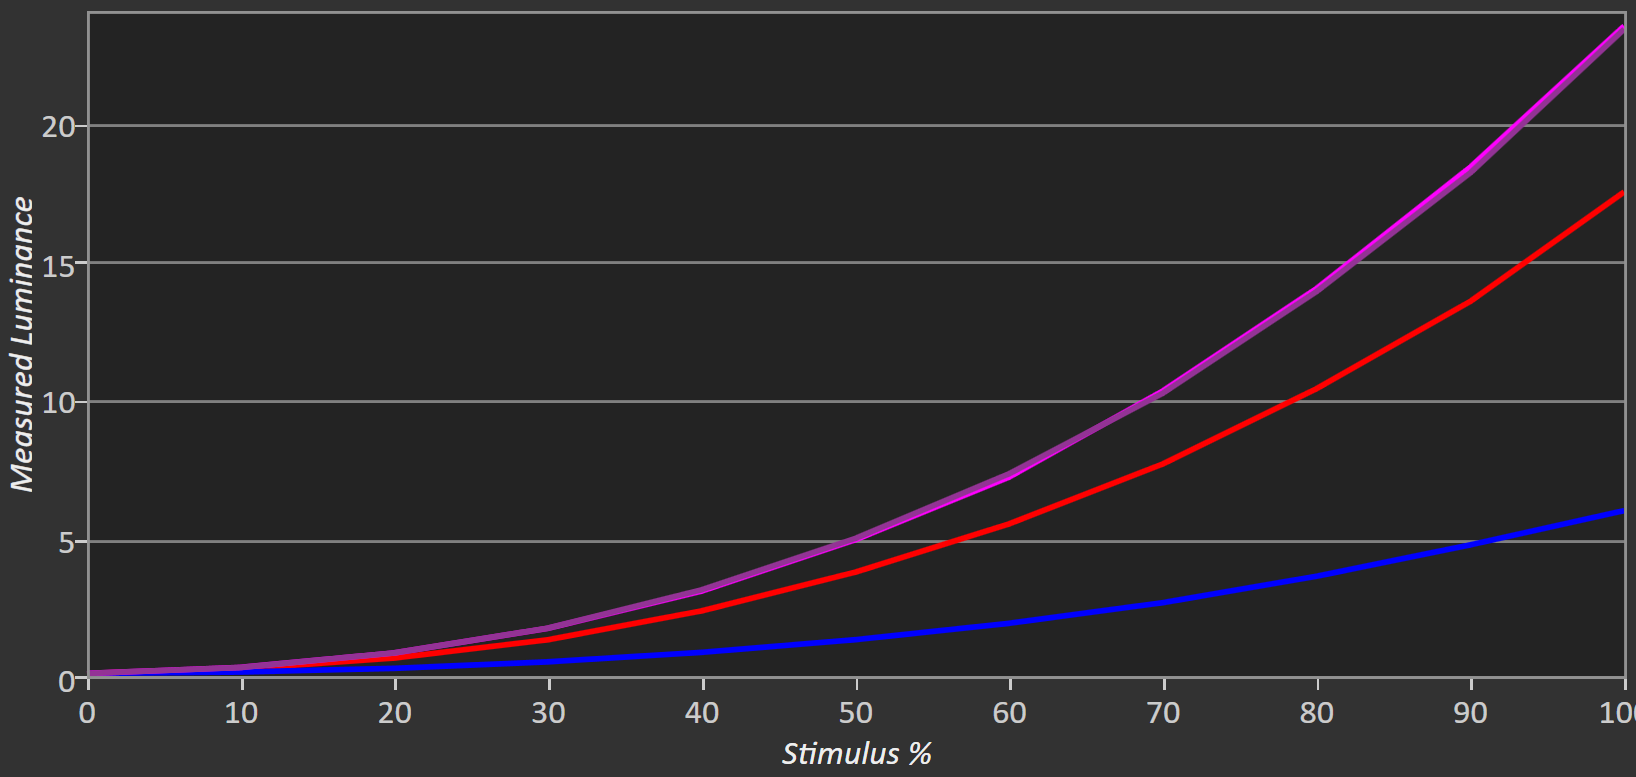
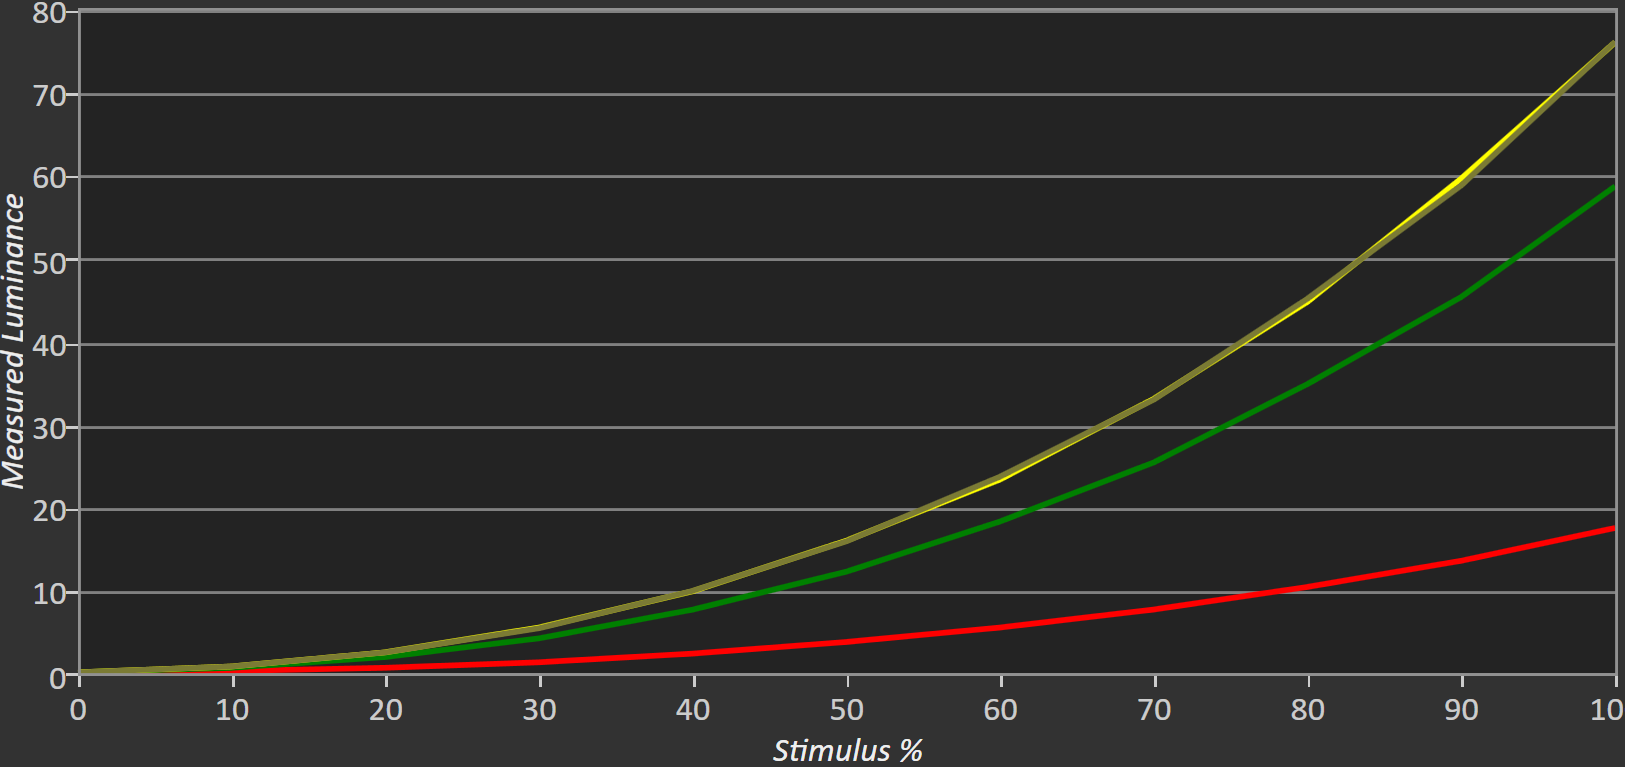
- Additivity graph for visualization of display additivity with the target line being the brighter and the measured combined line from RGB separation the darker of the two. Fully covering the brighter line is ideal. This graph shows the outer capabilities of the display device.
- Additivity delta graph for visualization of % error vs target for primaries and secondaries. The number of stimulus points is defined by [1] luminance ramp points selection. The percent error is given by the predicted and the actual measured behavior. An error of 0 is ideal. This graph quantifies the outer gamut luminance capabilities of the display device.
- Additivity delta graph for visualization of % error vs target for important colors within the gamut. Colors are defined by ColorChecker Classic. The percent error is given by the predicted and the actual measured behavior. An error of 0 is ideal. This graph quantifies the inner gamut luminance capabilities of the display device.
- CIE 1976 u’v’ graph for visualization of the inner gamut capabilities of the display device.
- Numbers button to display additional additivity information for primaries and ColorChecker data
Chart Options
To show various display options for the additivity charts, right-click on the chart and choose “Properties”

- Linear (Target) by Gamma
- Additivity chart property to linearize the EOTF for easier assessment of measured vs predicted lines.
- Additivity Delta
- To view measured vs predicted %error against stimulus % level and assess if the display device is additive or under/over tracking
- Chart Type
- Change between white, cyan magenta or yellow additivity assessment
- Manual Axis
- Define your Min, and Max y-axis values and tick size by entering your desired value, and pressing Enter/Return on your keyboard
FAQs:
How to measure display additivity?
- Click on the Read Series button located in the bottom right corner to capture data for both outer and inner gamut evaluation.
How to view display additivity data?
- Left-click on the “123” button [7] located in the bottom right corner of the action buttons
How to measure display additivity for primary and secondary colors?
Primaries
- Click on the Read Series button located in the bottom right corner and then on the Stop All button located next to the Read Series button after luminance ramp measurements for blue have been completed to evaluate the RGB separation of primaries.
Secondaries
- Click on the Read Series button located in the bottom right corner and then on the Stop All button after luminance ramp measurements for yellow have been completed.
- Left-click on the additivity chart type drop-down [2] and select a secondary color to evaluate the RGB separation.
Manual Operation
- Click on the left Additivity chart [3]
- Select which luminance ramp you want to measure with the color selector in the bottom left

- Select which patch you want to measure by left-clicking on the patch present on the horizontal patch selector

- Click on the Read Single button located in the bottom right corner to take a reading
How to measure display additivity for specific colors within the gamut?
- Click on a graph element under the ColorChecker section to the right such as [6] CIE 1976 u’v’ chart.’
- Select which patch you want to measure by left-clicking on the patch present on the horizontal patch selector.
- You have to measure Black (0,0,0), White (1023,1023,1023), White_R(1023,0,0), White_G(0,1023,0), and White_B(0,0,1023).

- Click on the Read Single button to take a reading. Repeat the process three more times for the color you’re interested in for display source reproduction. The first patch represents the RGB triplet for the color while the subsequent three represent the R, G, and B separated components for that color.
How to Export Additivity Data?
To use this feature you have to have an active professional license.
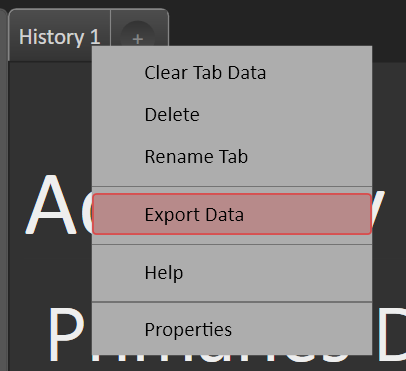
- Right-click on the history tab
- Select Export Data
- Click on the checkbox next to Include available additivity data
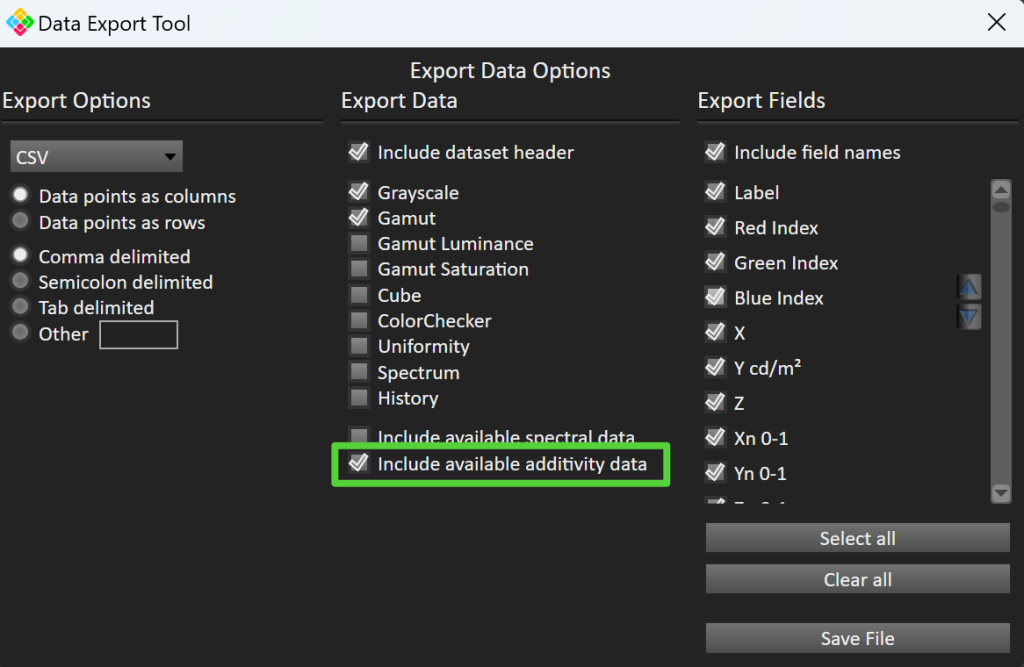
- Click on the Save File button to define the file name and location for the exported data
Additivity Report
To view, save, and print out your additivity report check the Report checkbox next to the Additivity button on the SDR or HDR toolkit welcome page.
1. Click on the top left Calman menu button
2. Select Open Report Template and choose HDR Analysis Report or select Current Report
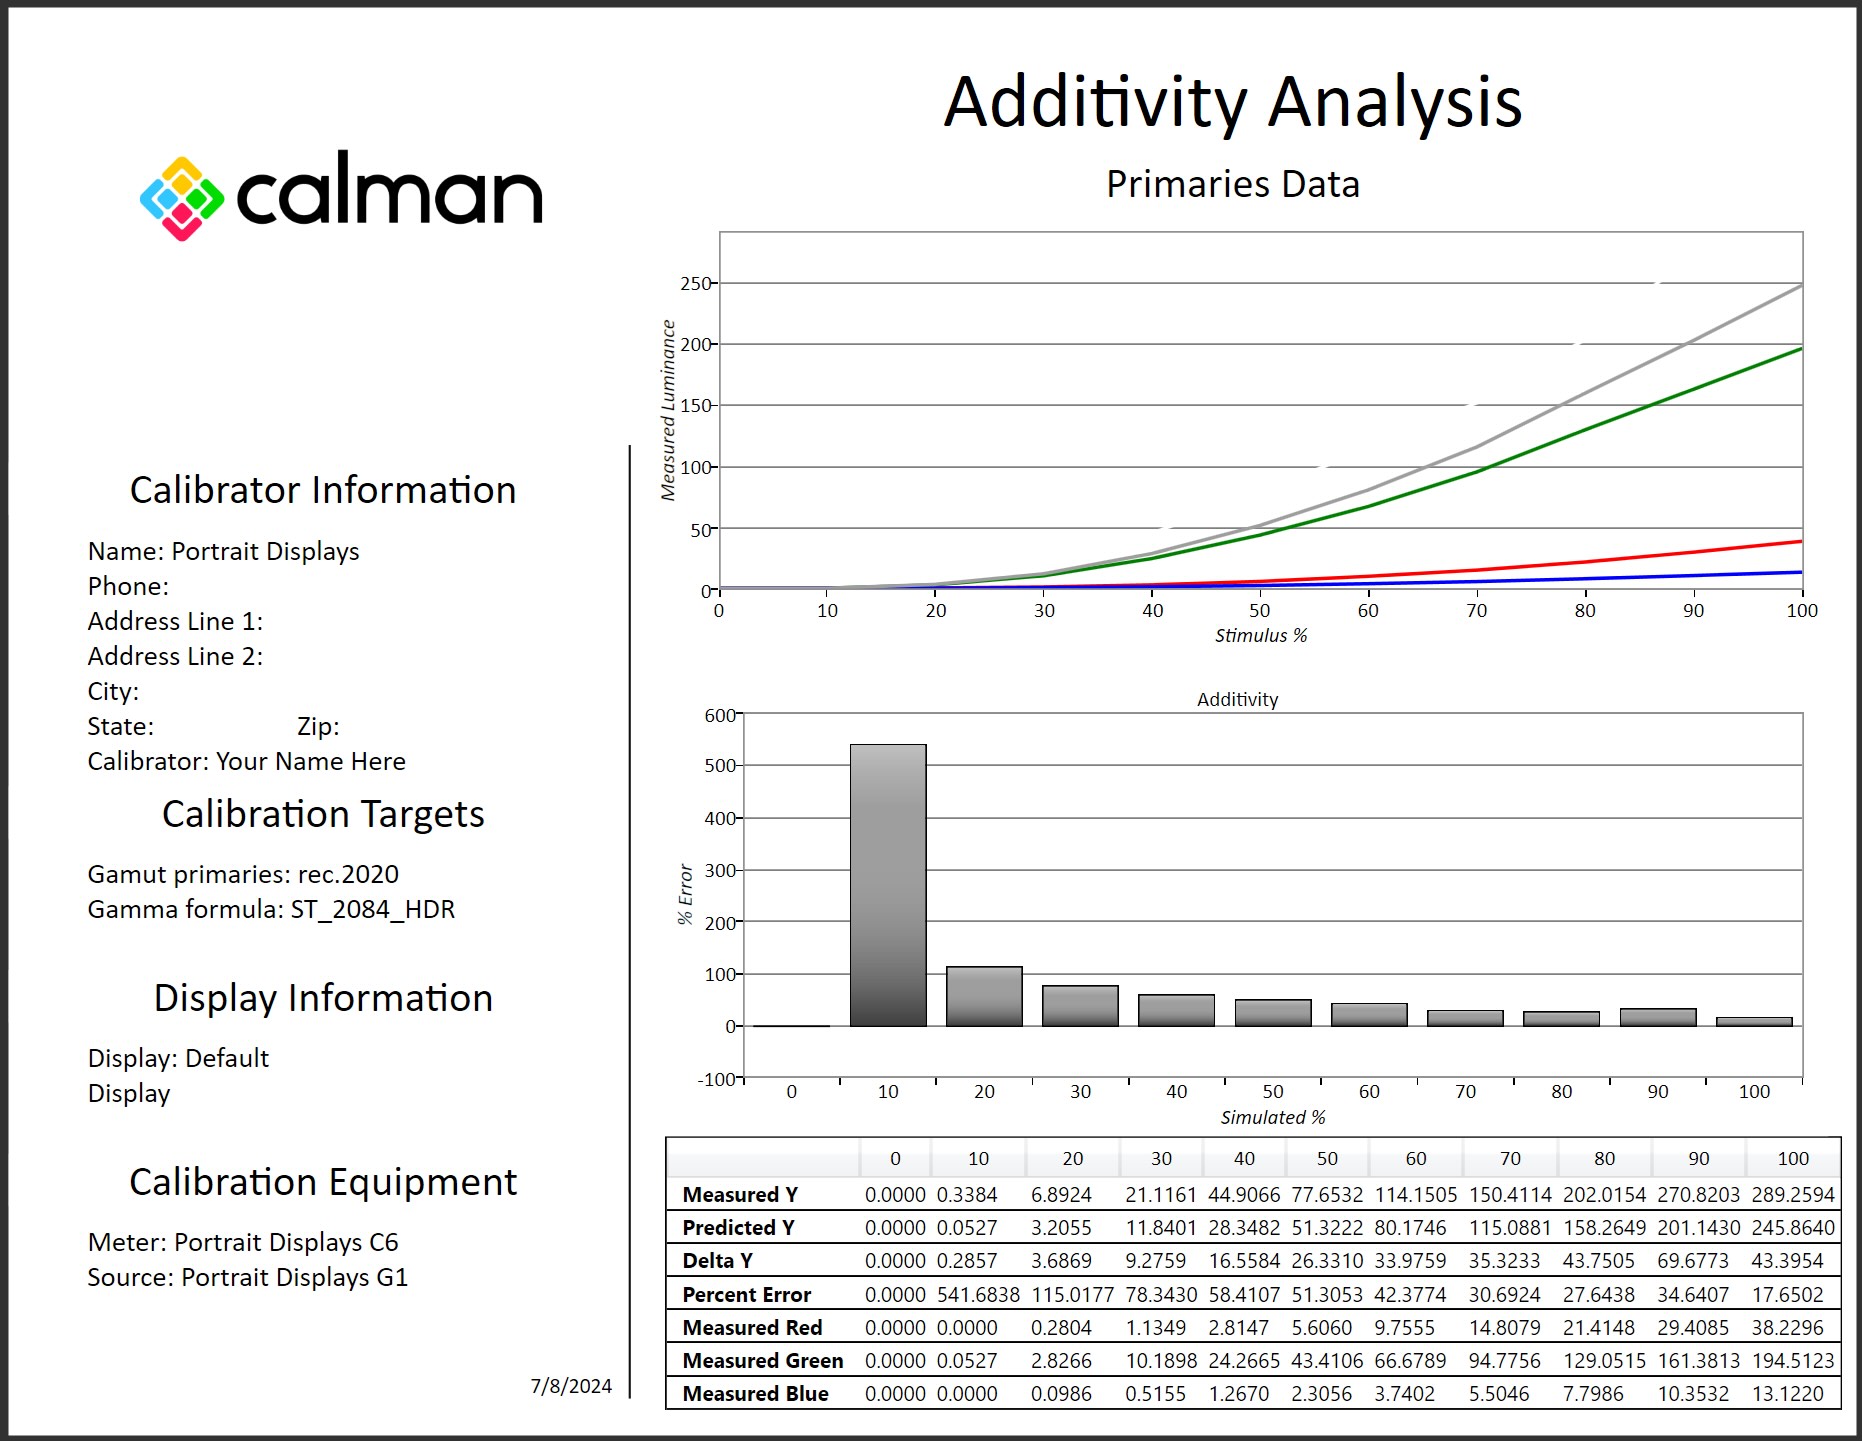
3. Click on the Export to PDF Button to save the report and by defining the file name and location
4. Click on the Print Report button to print out the report
