
The Calman Toolkit Workflow offers a way to explore your display’s performance using Calman’s industry-standard analysis tools. You can choose the tests and views that matter to you, examine key performance metrics, and build a clearer understanding of your display’s accuracy. Use it as a convenient starting point for evaluating picture quality and supporting your calibration workflow.
Calman Required Version
- Calman Studio or Ultimate v5.17.0 or higher
Tool Index
- From the Calman Menu in the top-left, choose Open Workflow Template -> Calman Tools and then Calman Toolkit
- Click Next on the Welcome page to proceed to the Tool Index.
The Toolkit tool index gives you a centralized location to select tests to run and report. The function of each test will be covered later in the article.
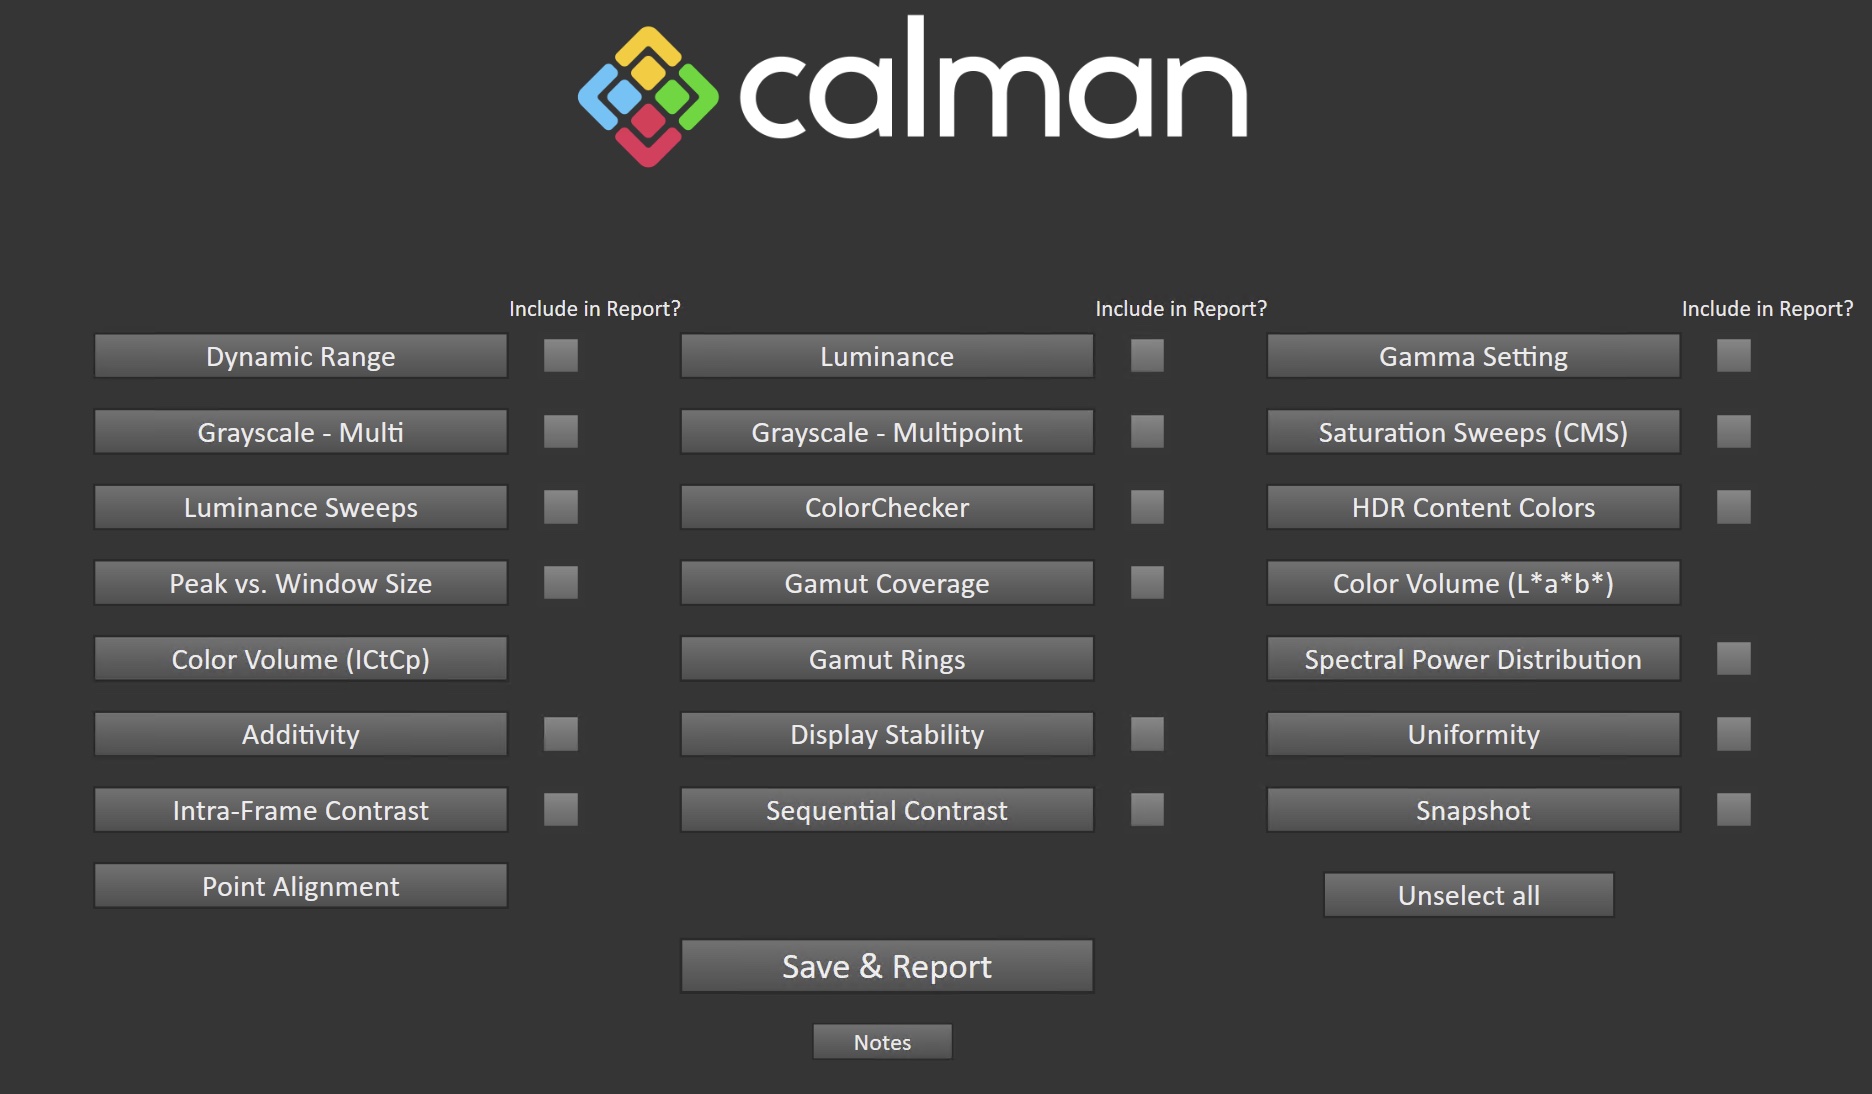
- Once data is measured into a given test page, the data will automatically be included in the PDF report if you choose to generate that. If you wish to exclude some test data from the report, uncheck the “Include in Report?” checkbox here.
- The notes button will provide a text field for you to document any notes, which will also be included in the PDF report
- Save & Report will save the current Calman session, including measurement data, and generate the PDF report.
Dynamic Range
This page is designed to evaluate a display’s brightness, Contrast, and detect any possible clipping
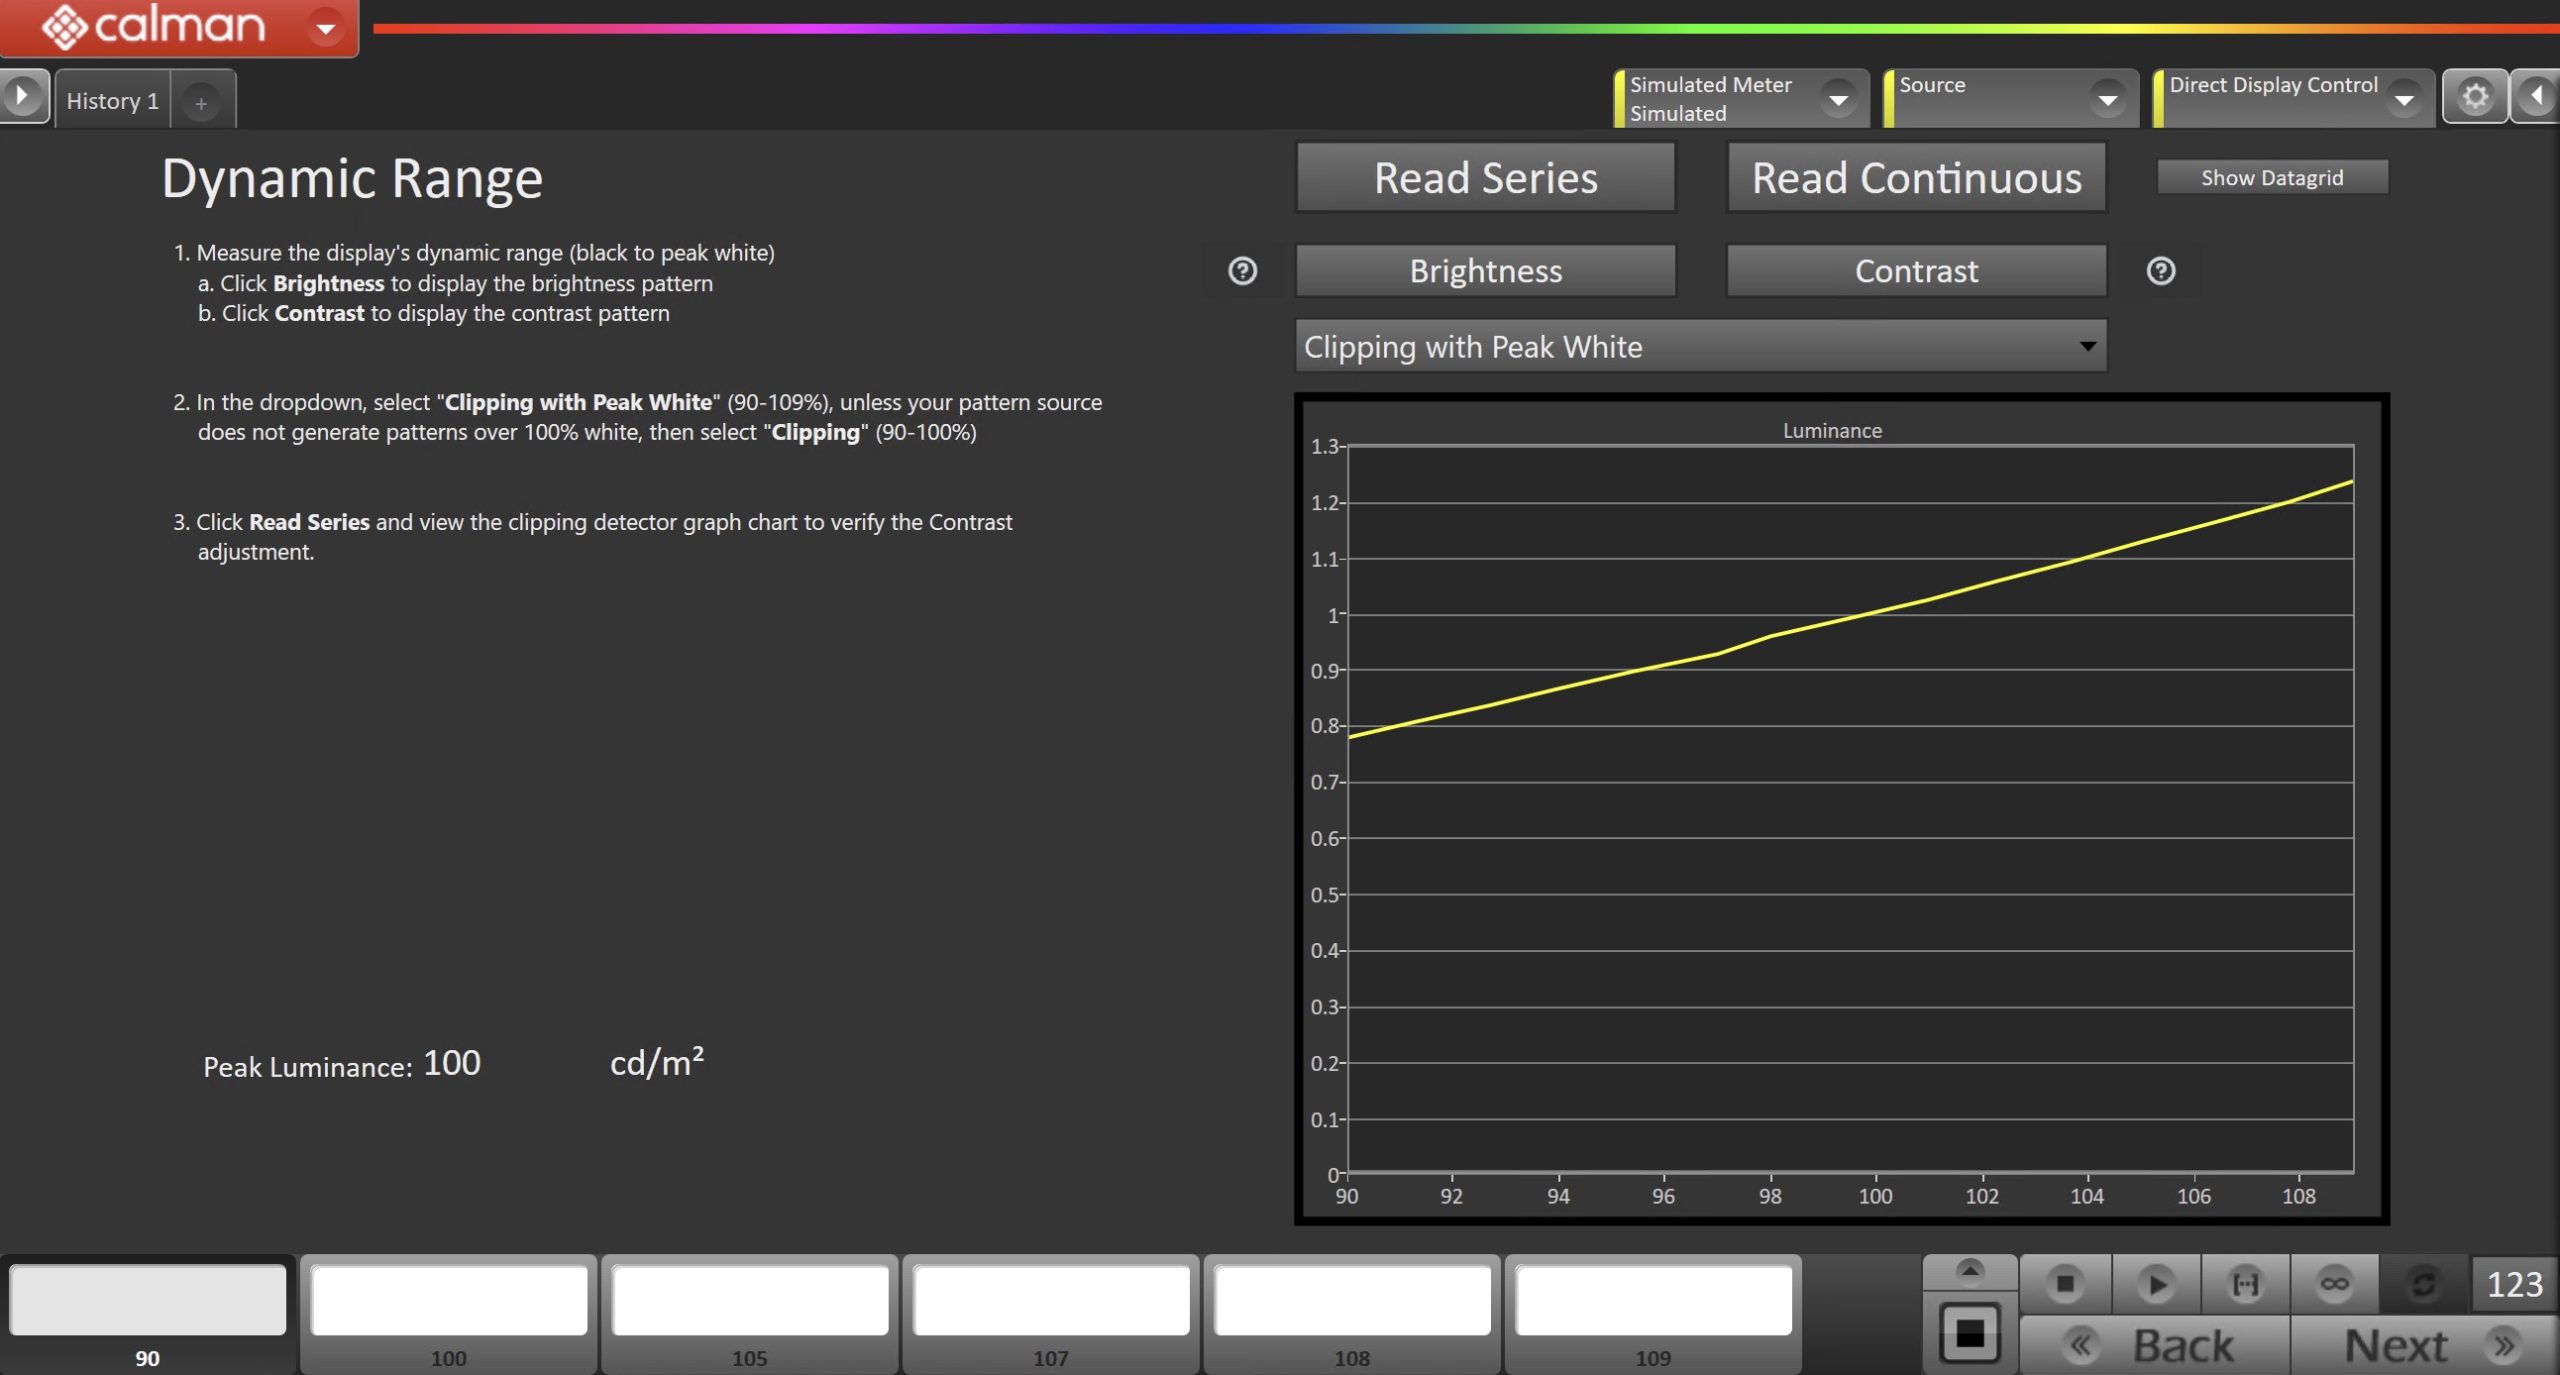
- Measure the display’s dynamic range (black to peak white)
- Click Brightness to display the brightness pattern
- Click Contrast to display the contrast pattern
- In the dropdown, select “Clipping with Peak White“ (90-109%), unless your pattern source does not generate patterns over 100% white, then select “Clipping” (90-100%)
- Click Read Series and view the clipping detector graph to verify the Contrast.
Luminance
This page is designed to evaluate a display’s light output when displaying full white.
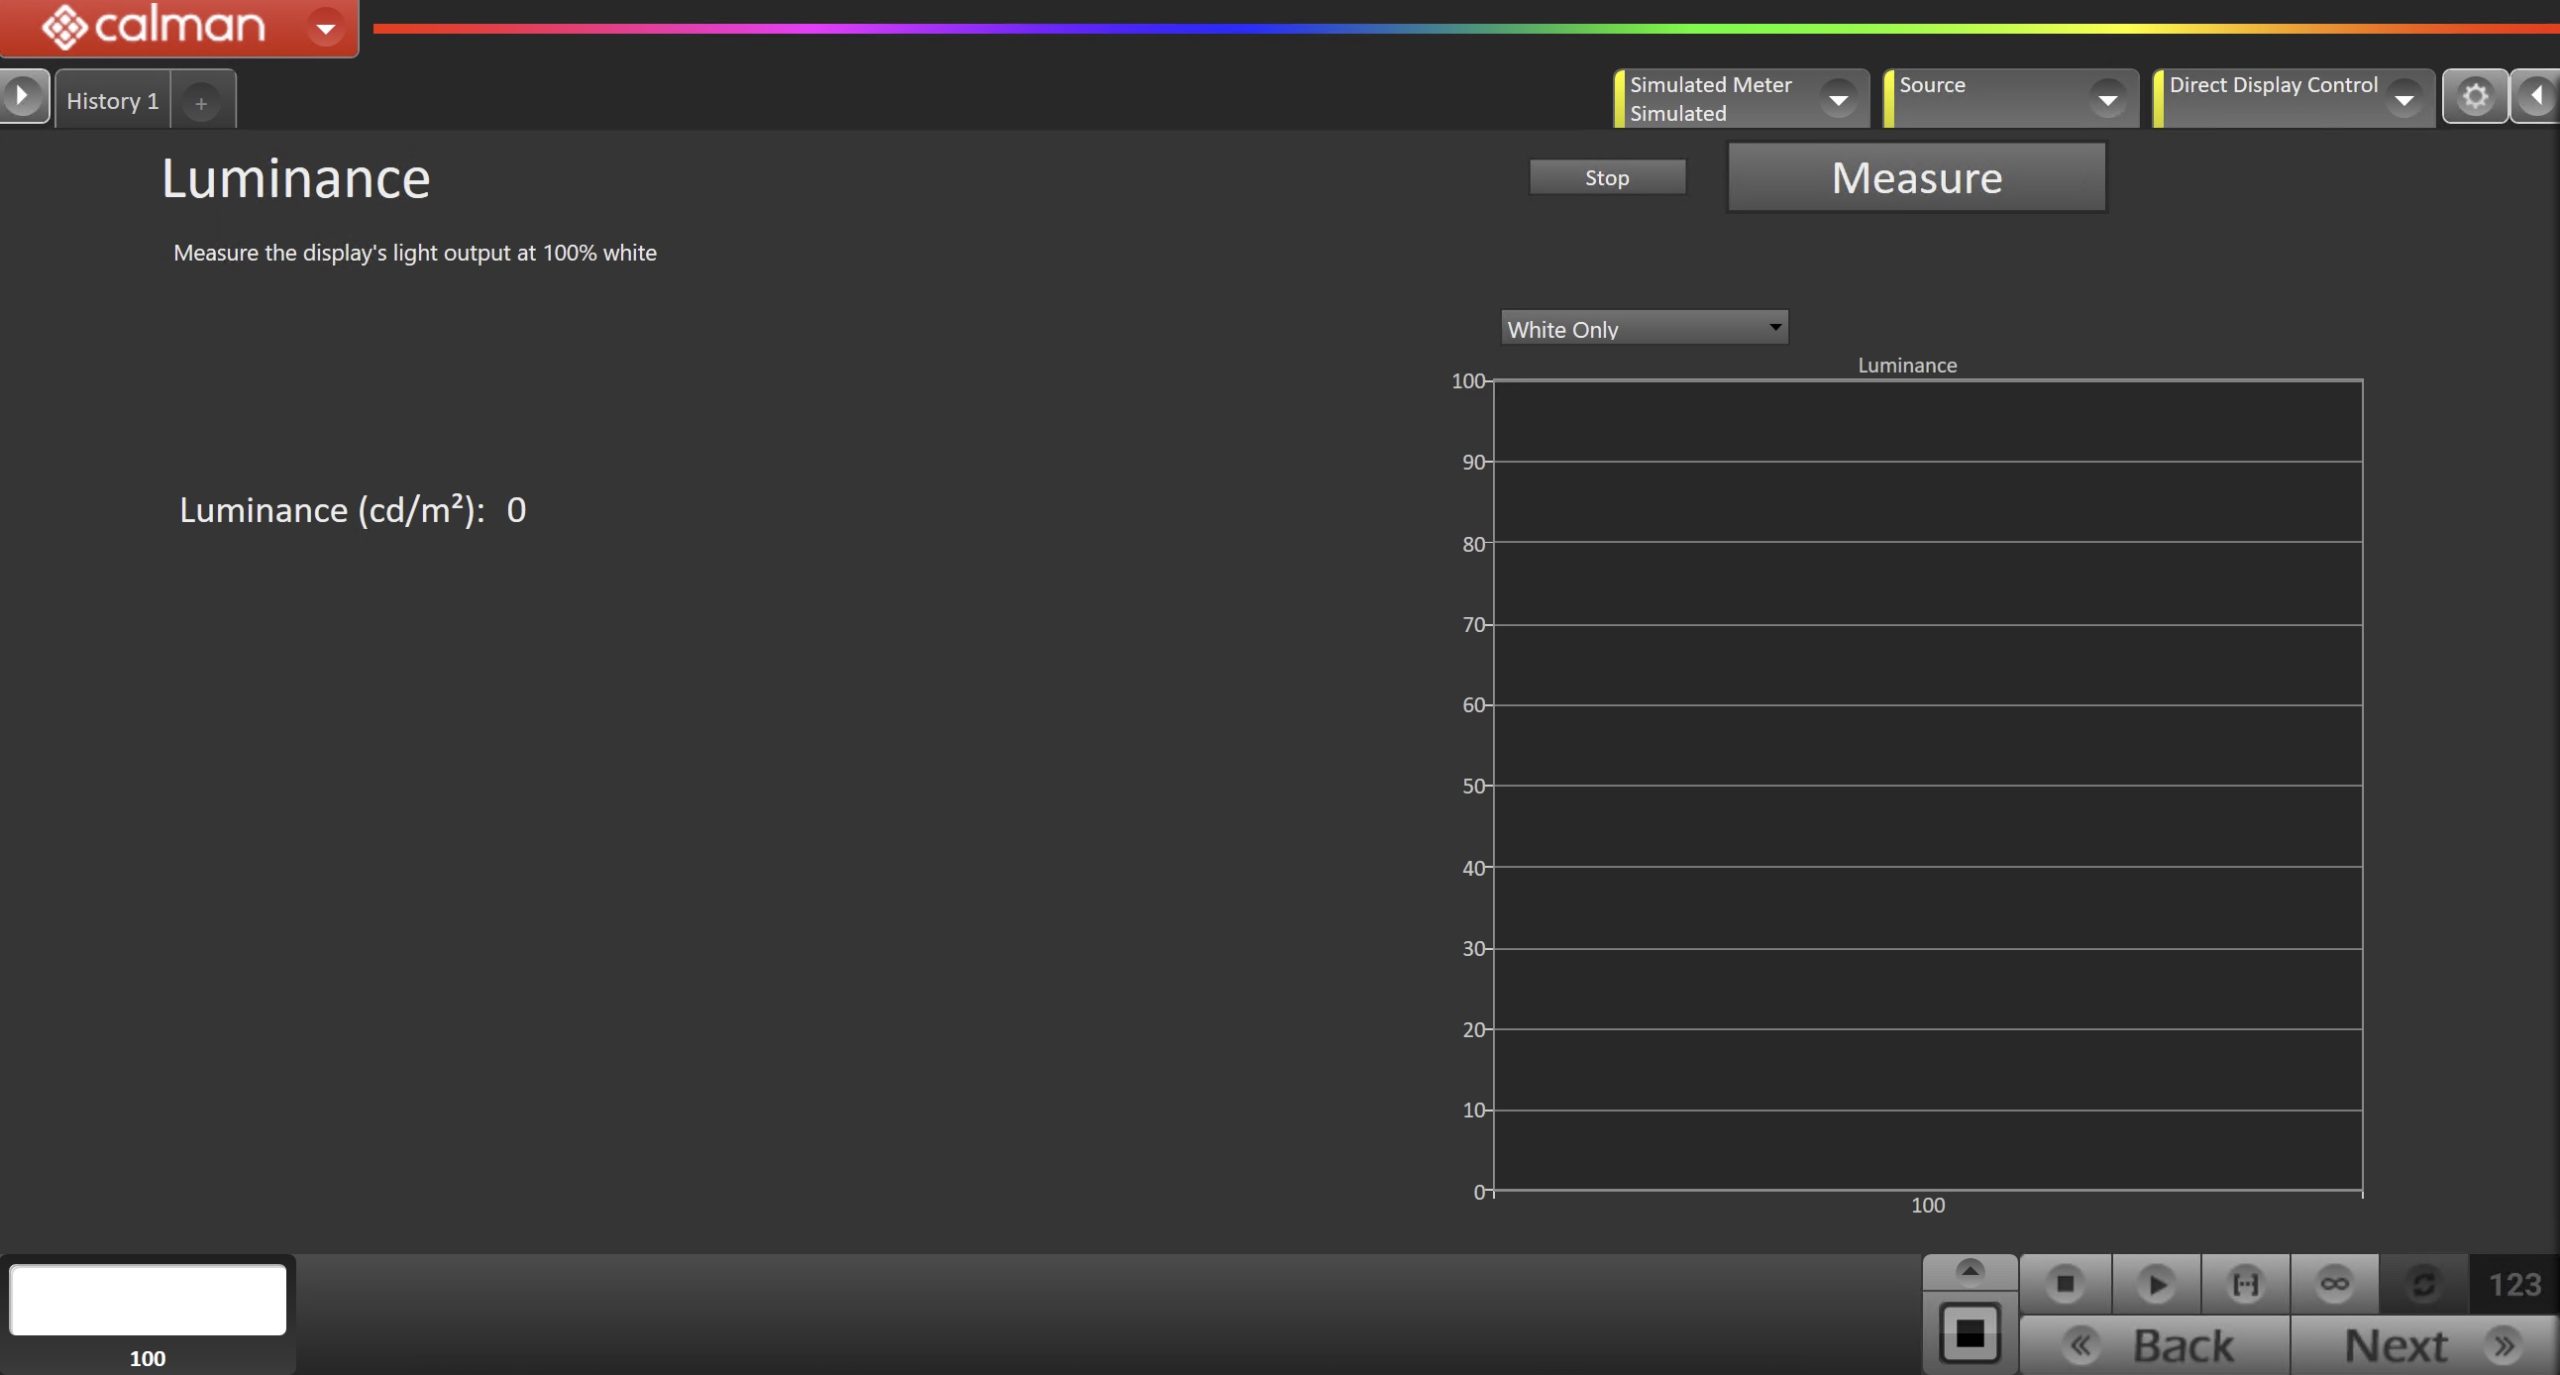
- Click Read Single to measure the display’s luminance.
Gamma Setting
This page is designed to measure and evaluate the display’s gamma performance.
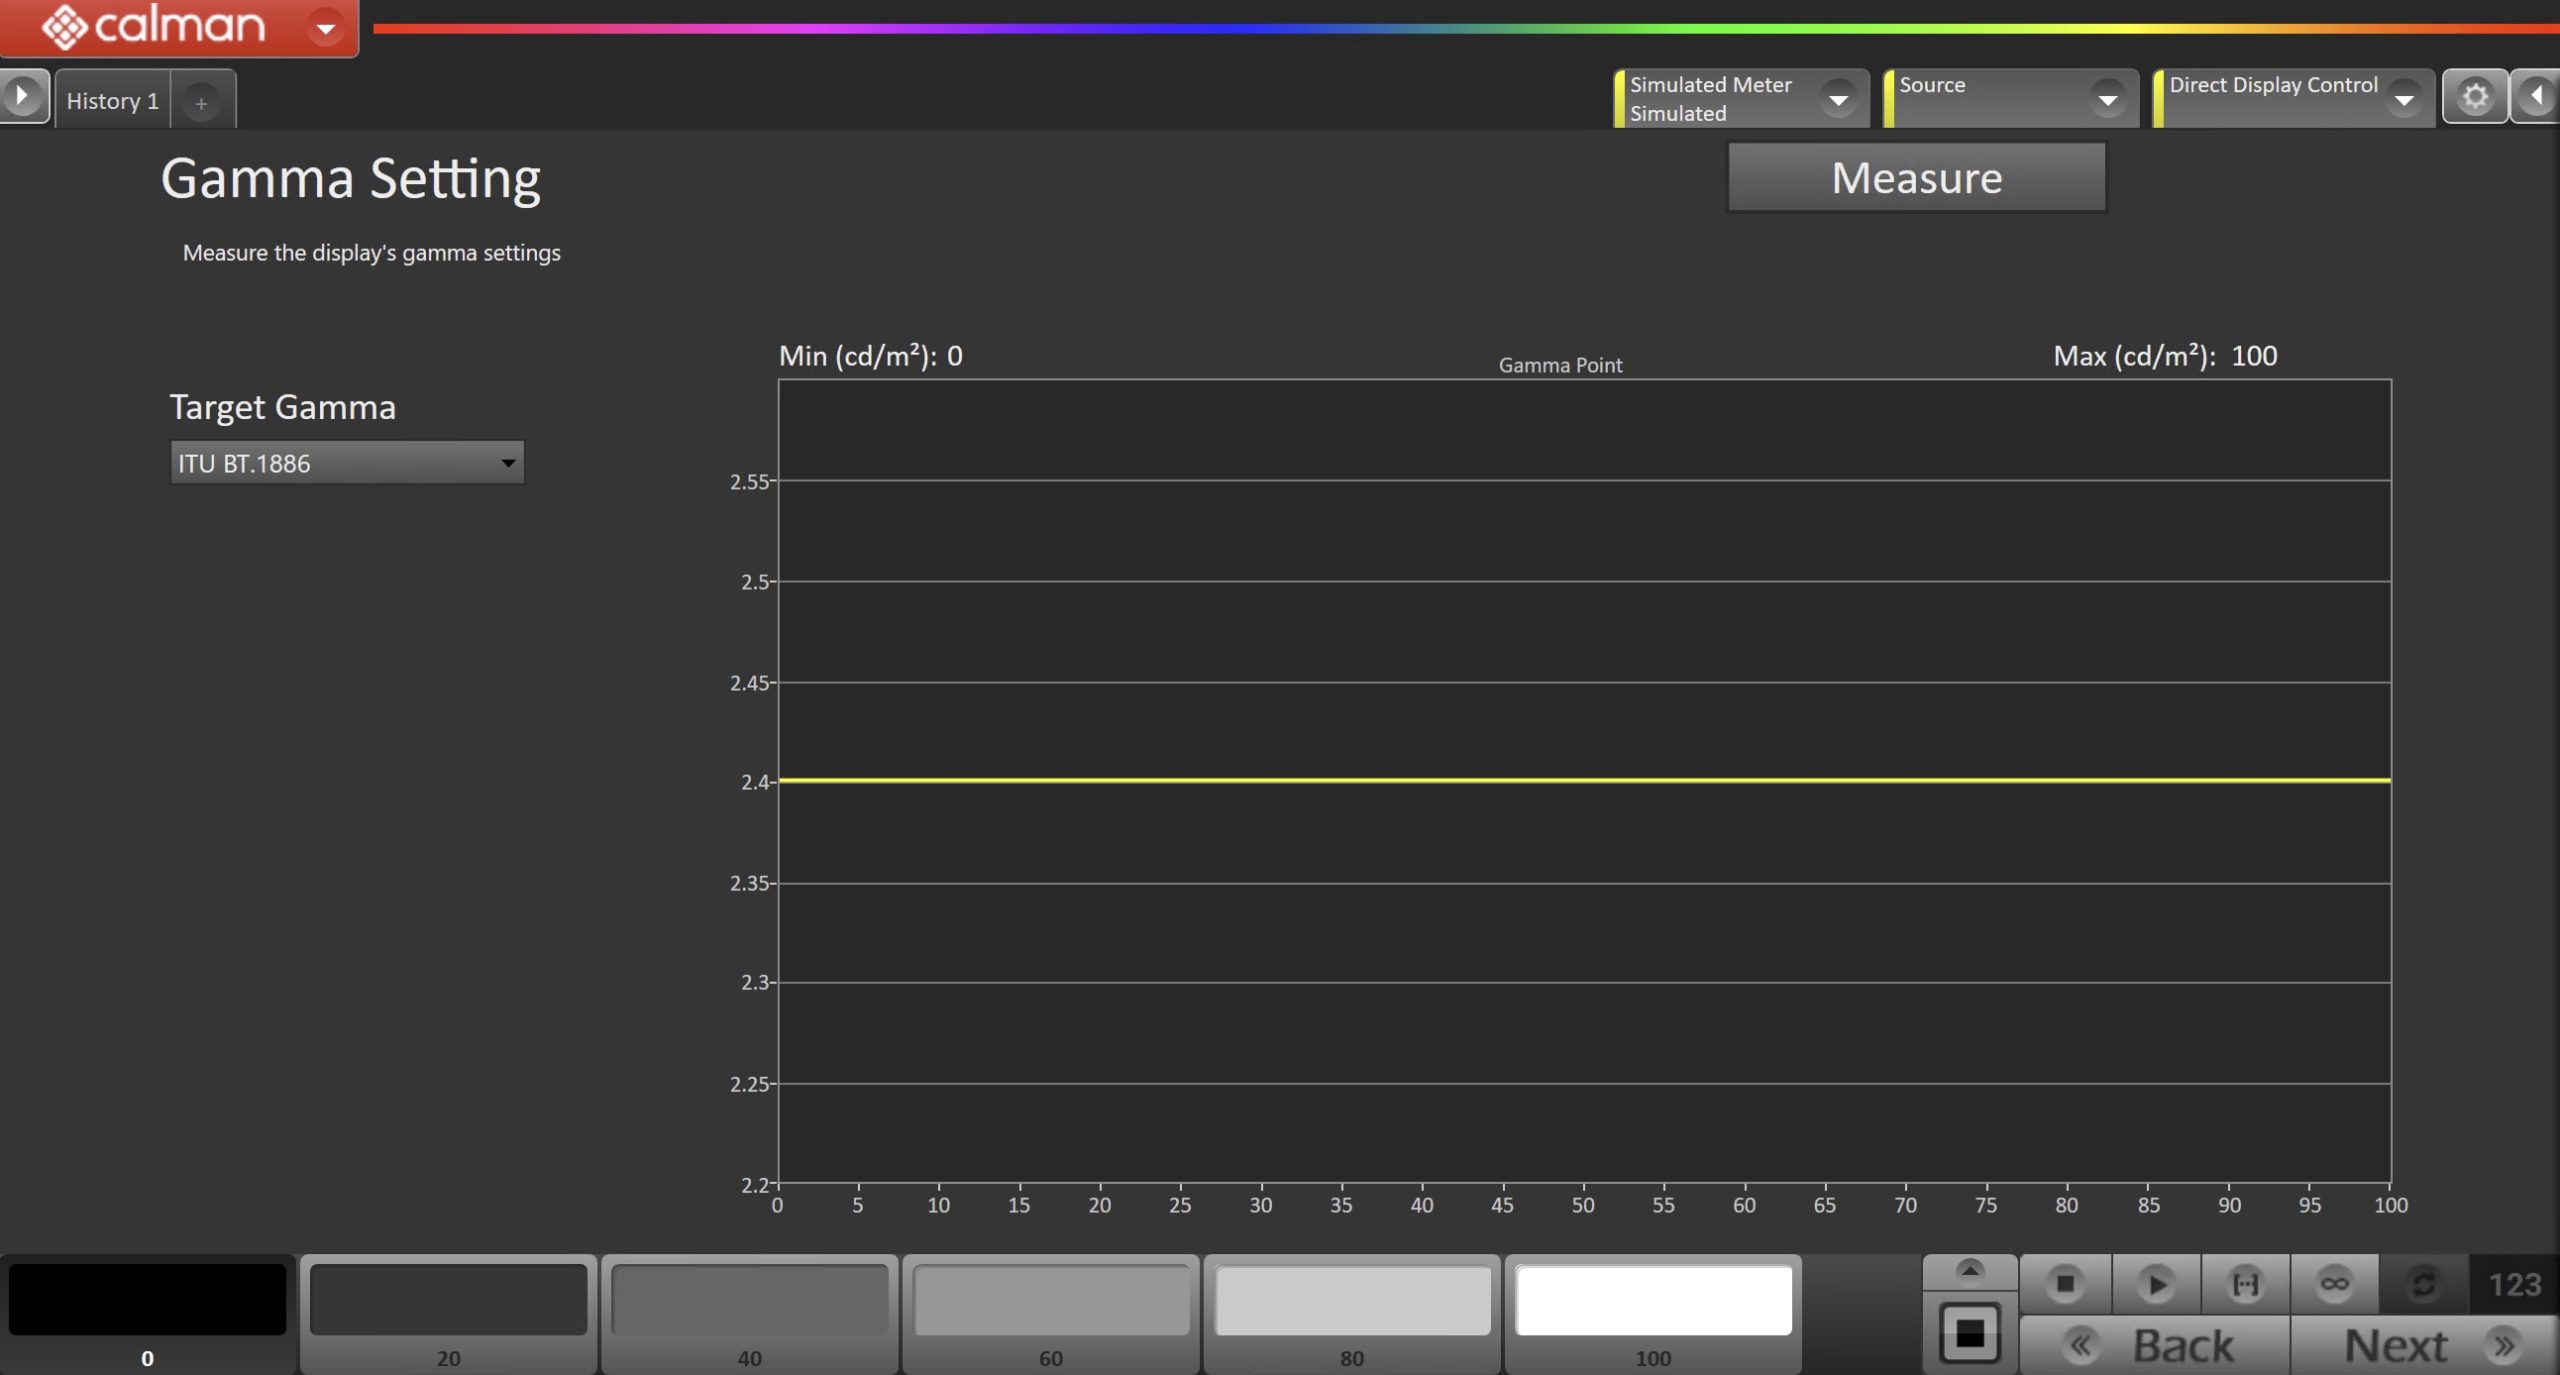
- Ensure the Target Gamma is set to the appropriate target, and click Read Series to measure the display’s gamma performance.
Grayscale – 2 point (White Balance)
This page will evaluate your display’s white balance, using 2 grayscale point levels.
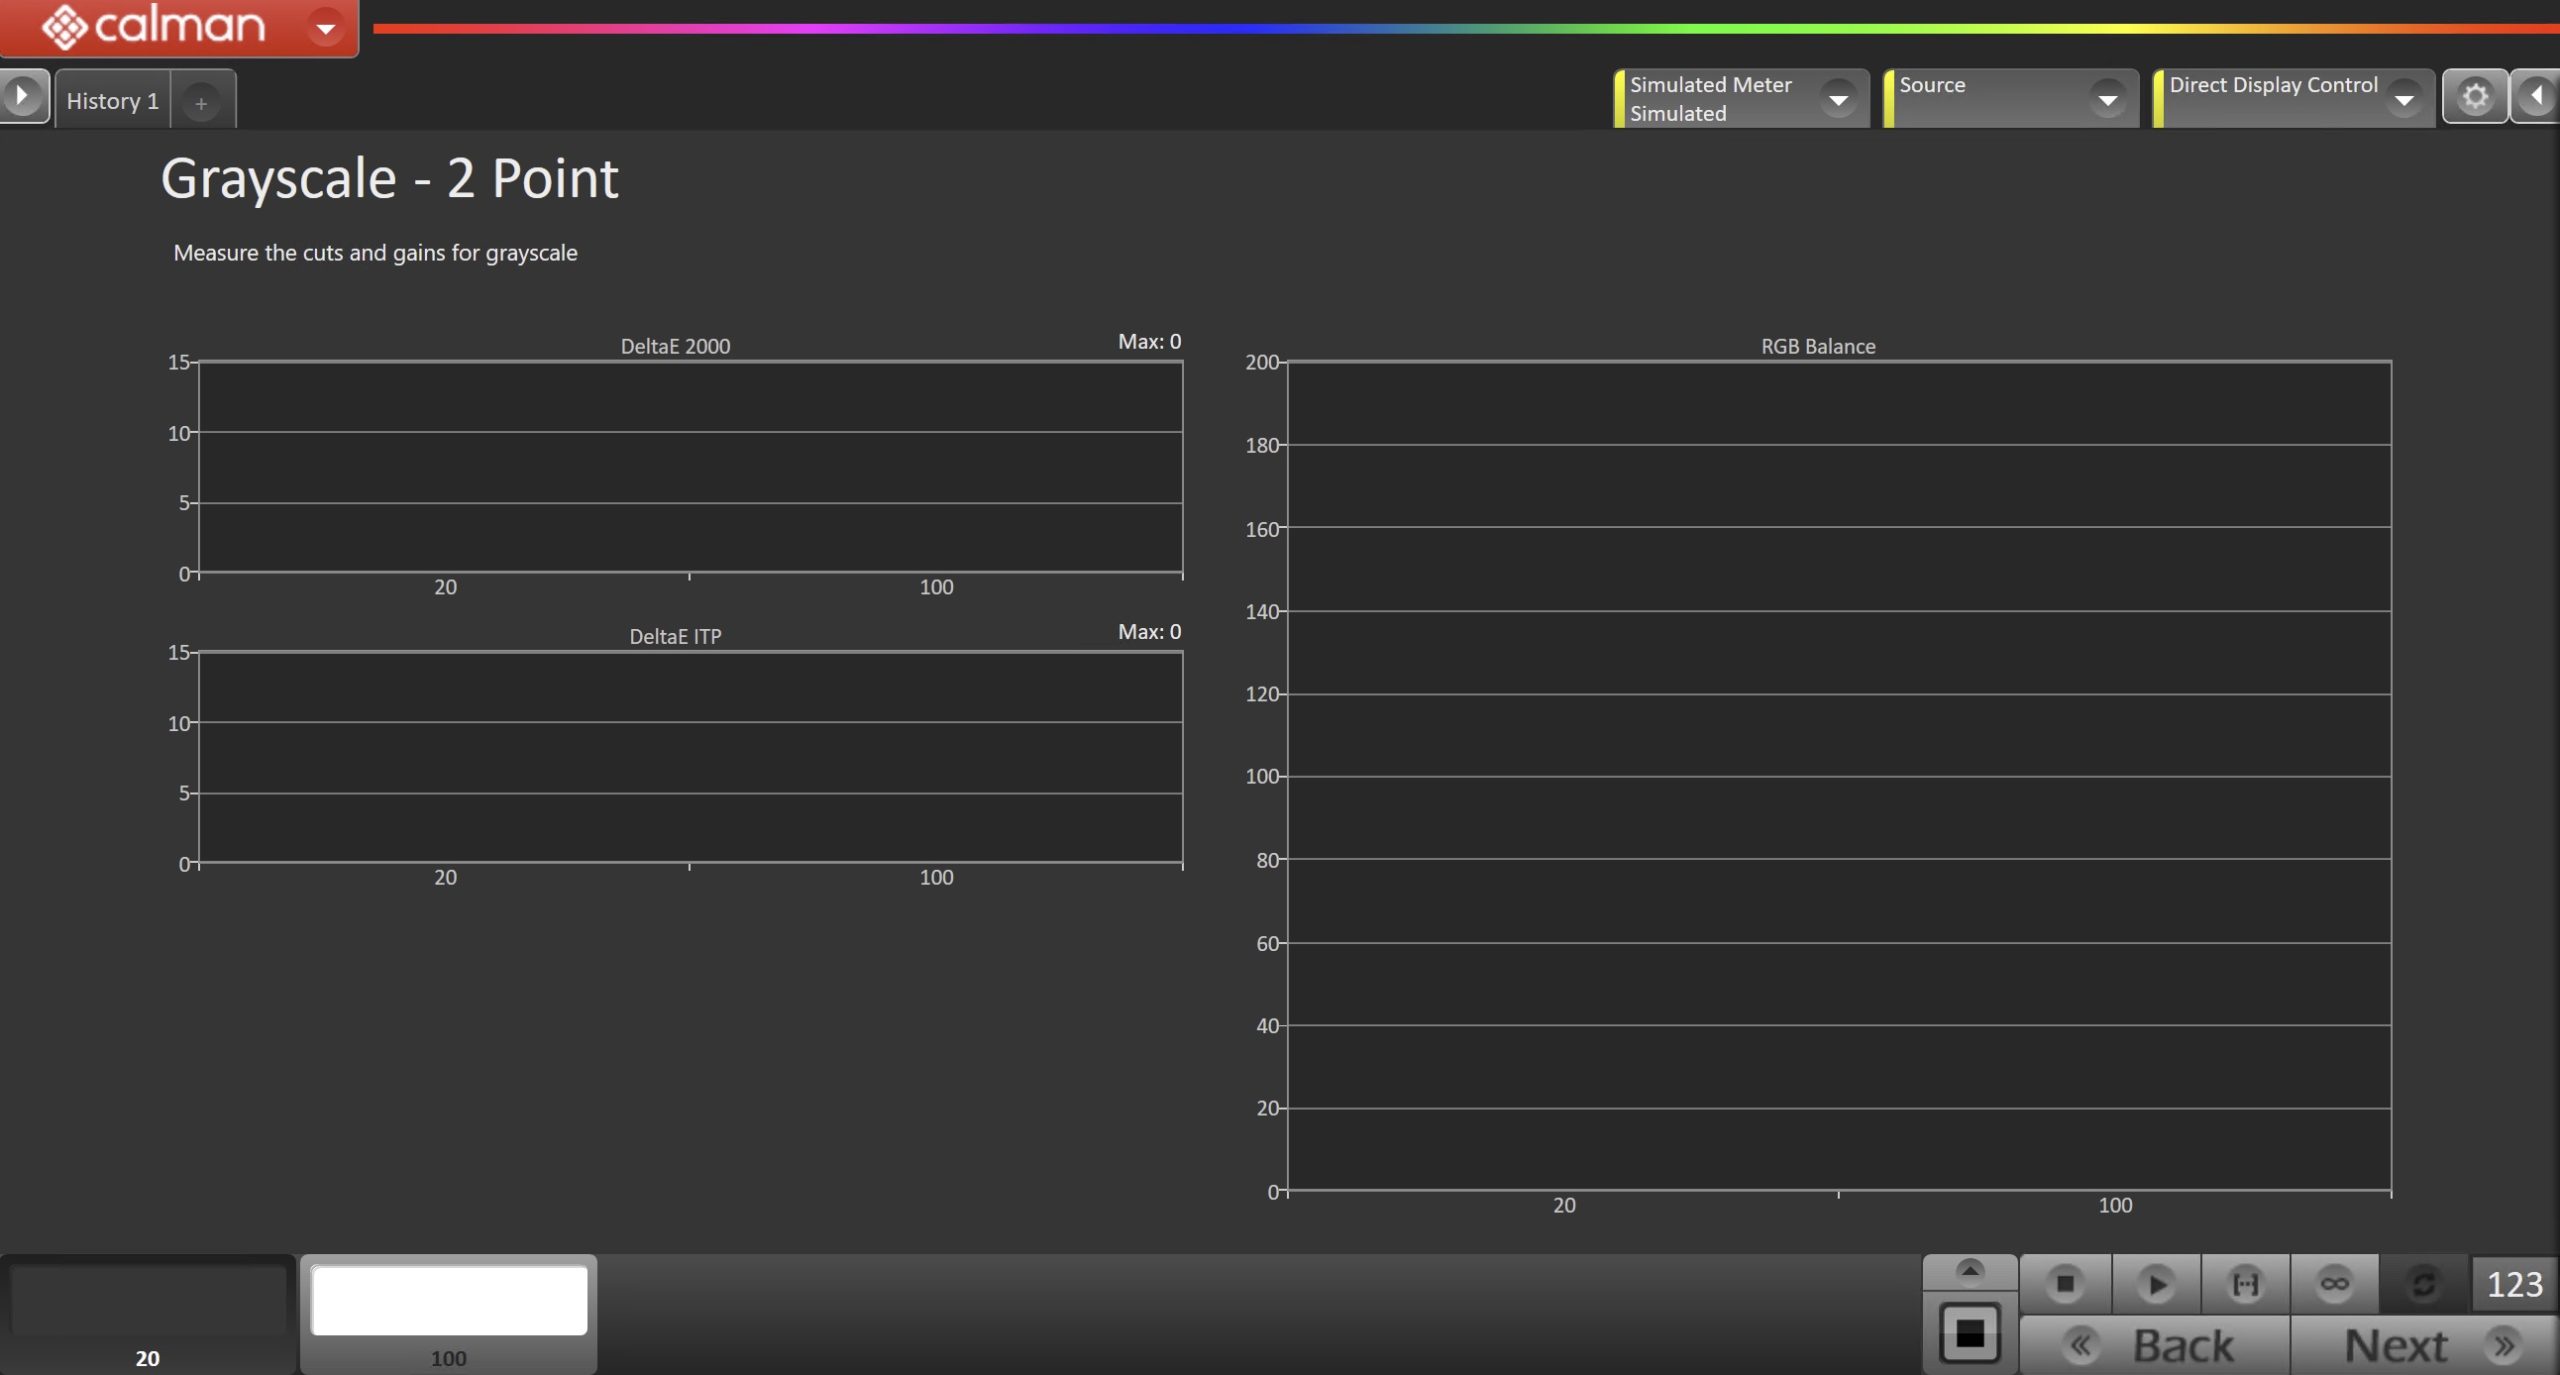
- Click Read Series to measure.
Grayscale – Multipoint
This page will evaluate your display’s white balance, using multiple grayscale point levels distributed evenly throughout the range.
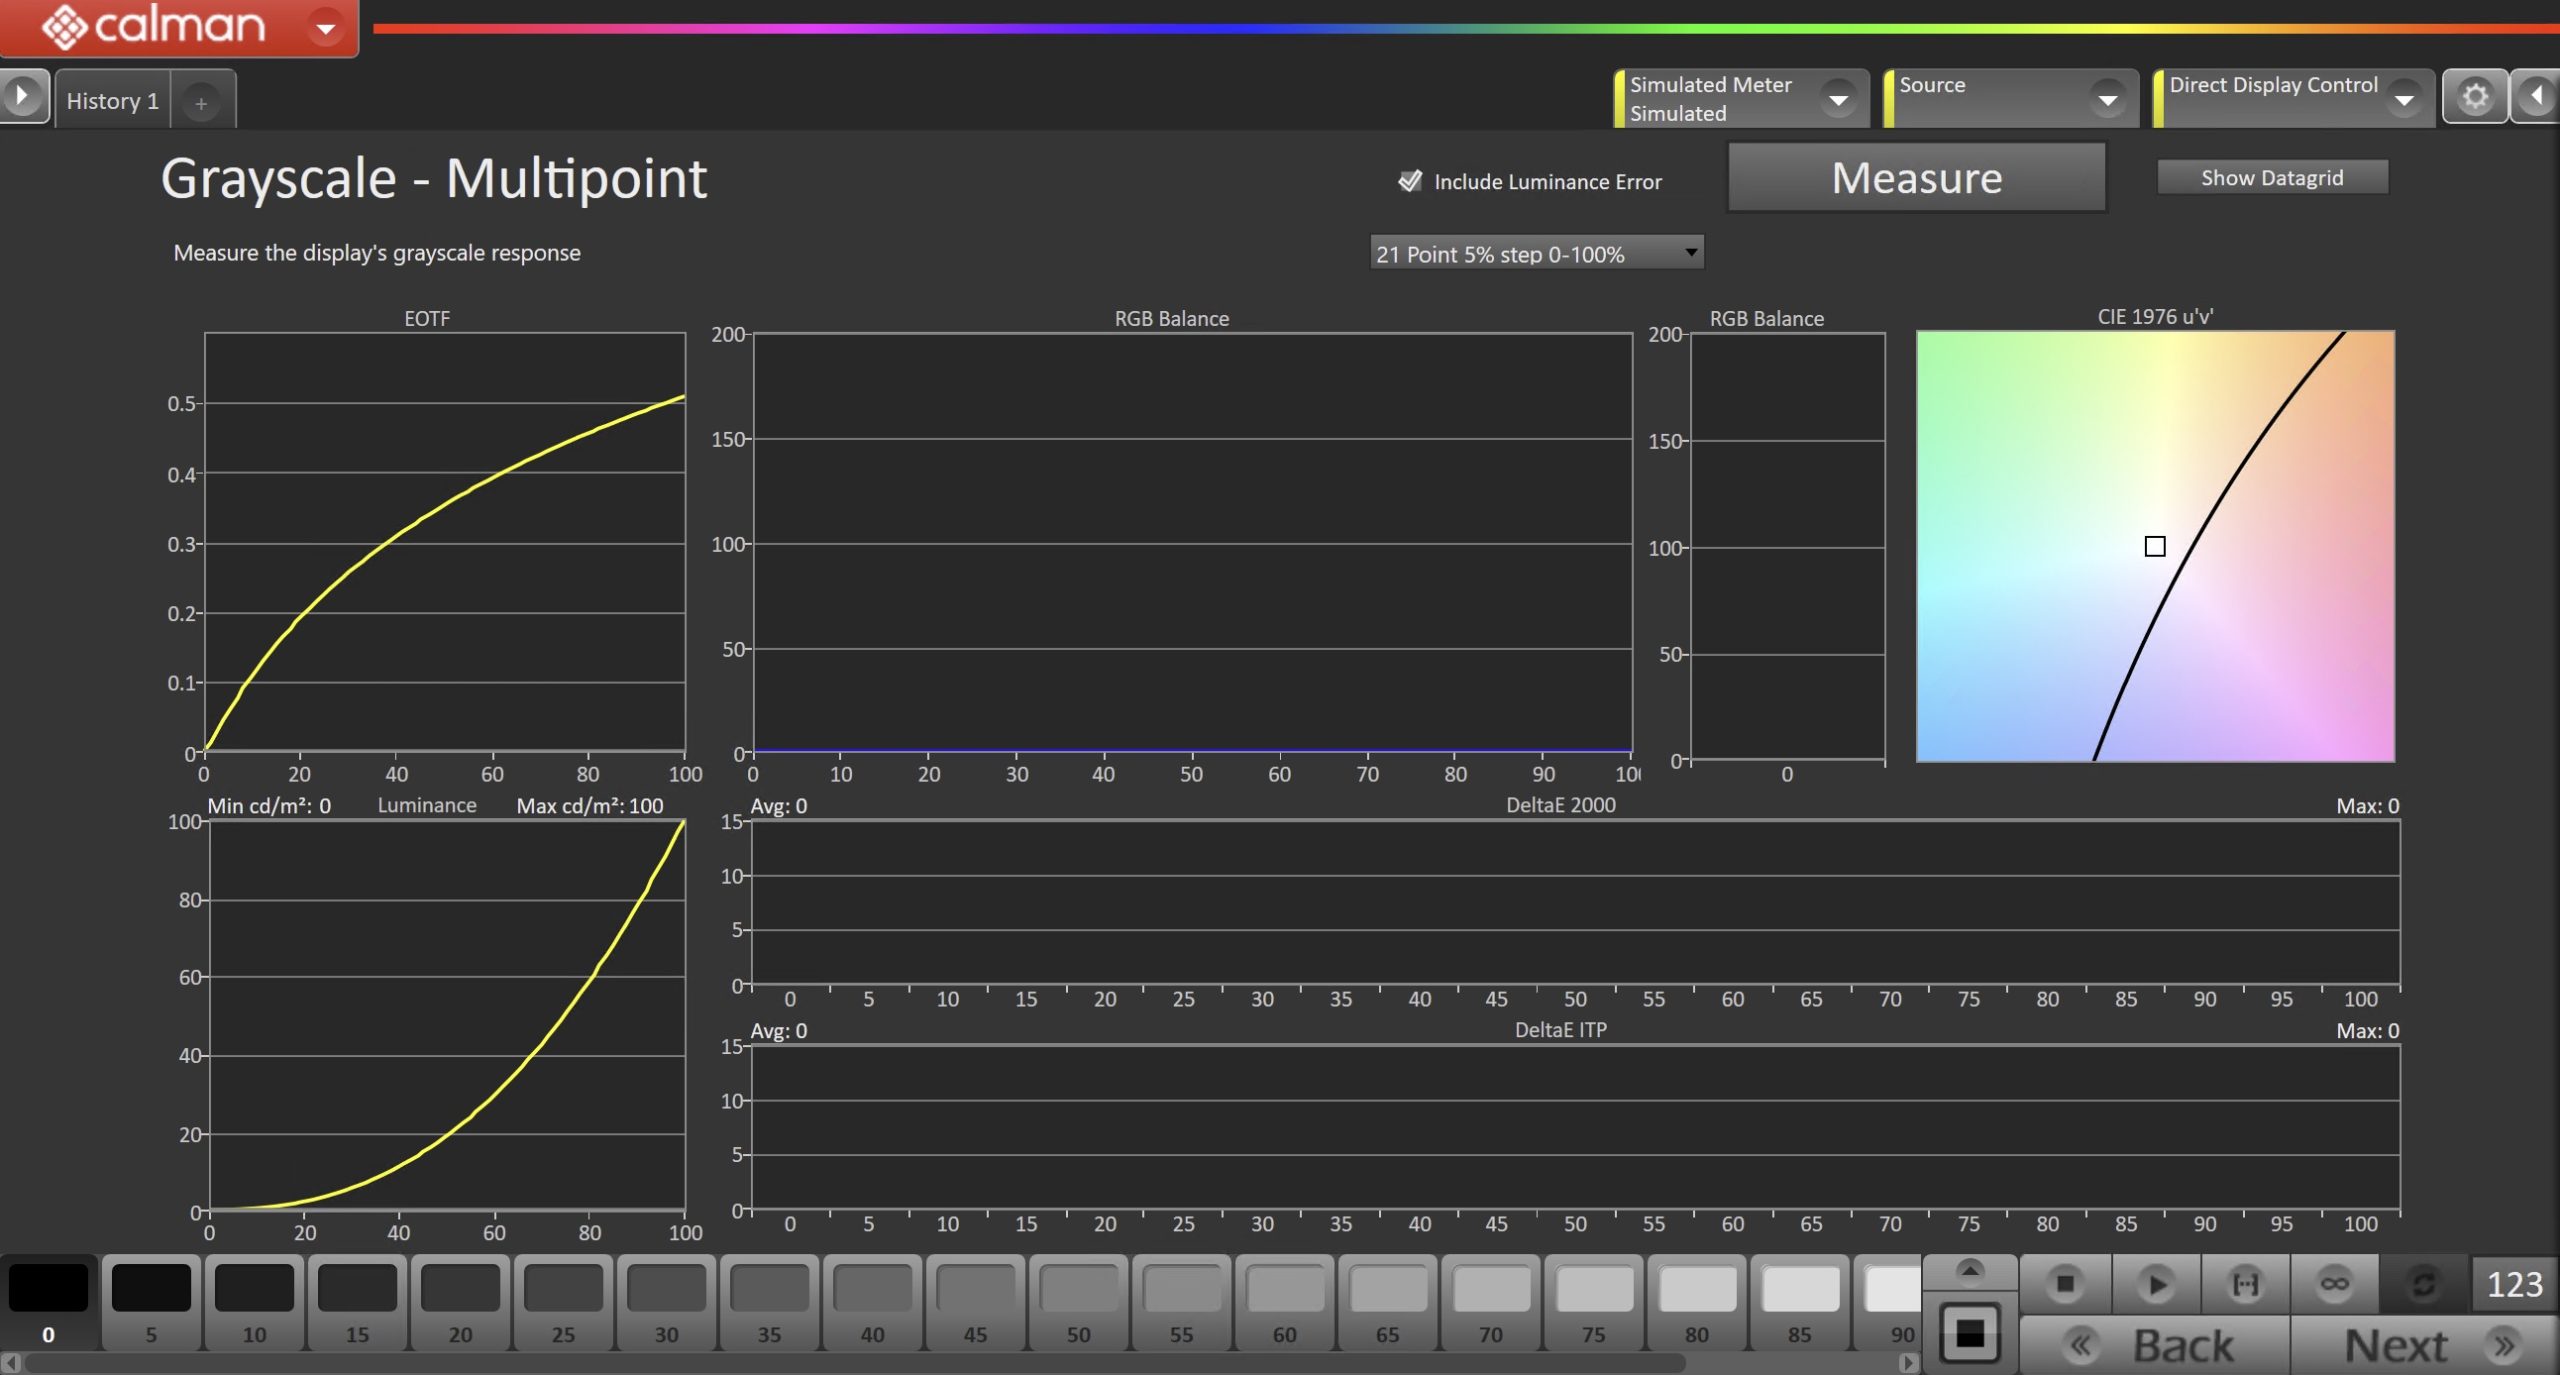
- Select your desired amount of points from the dropdown above the graphs (default will be 21 points 5% steps), and click Read Series to measure.
Saturation Sweeps (CMS)
This page will be used to evaluate the Color Gamut performance using evenly distributed saturation levels for each primary and secondary color.
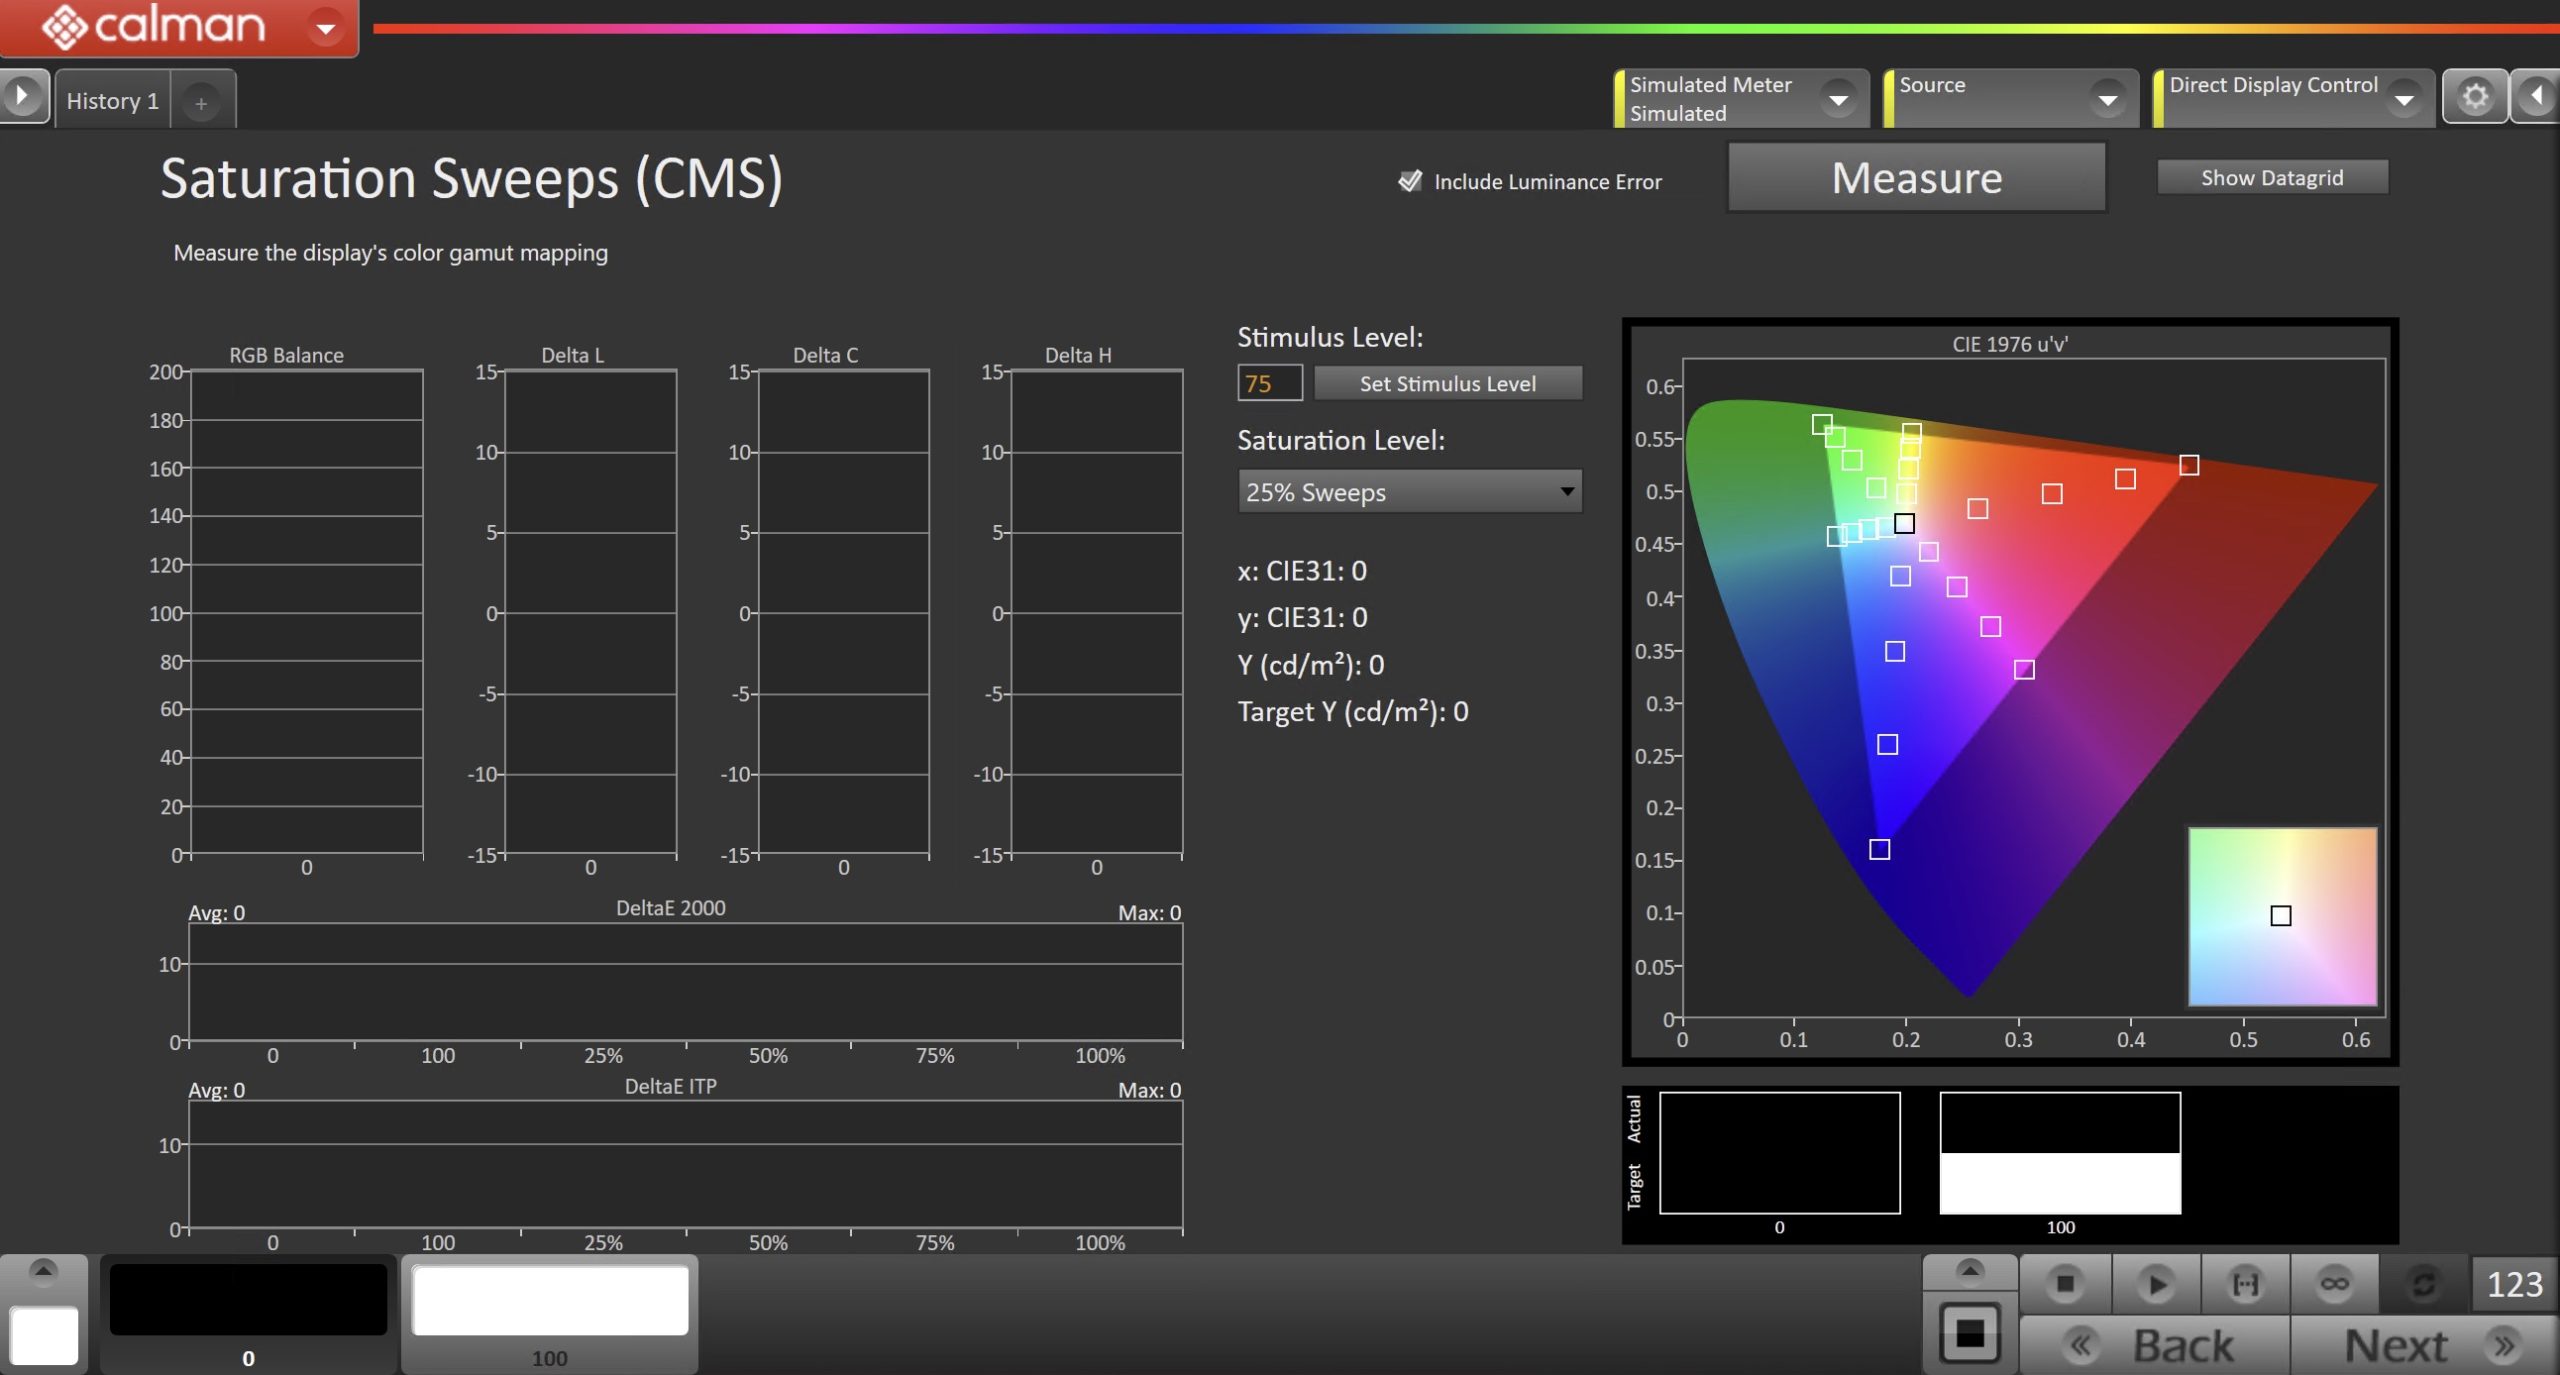
- Set your desired stimulus level and amount of points in the sweeps (lower percentage equals more points), and click Measure.
Luminance Sweeps
This page will be used to evaluate the Color Gamut performance using evenly distributed luminance levels for each primary and secondary color.
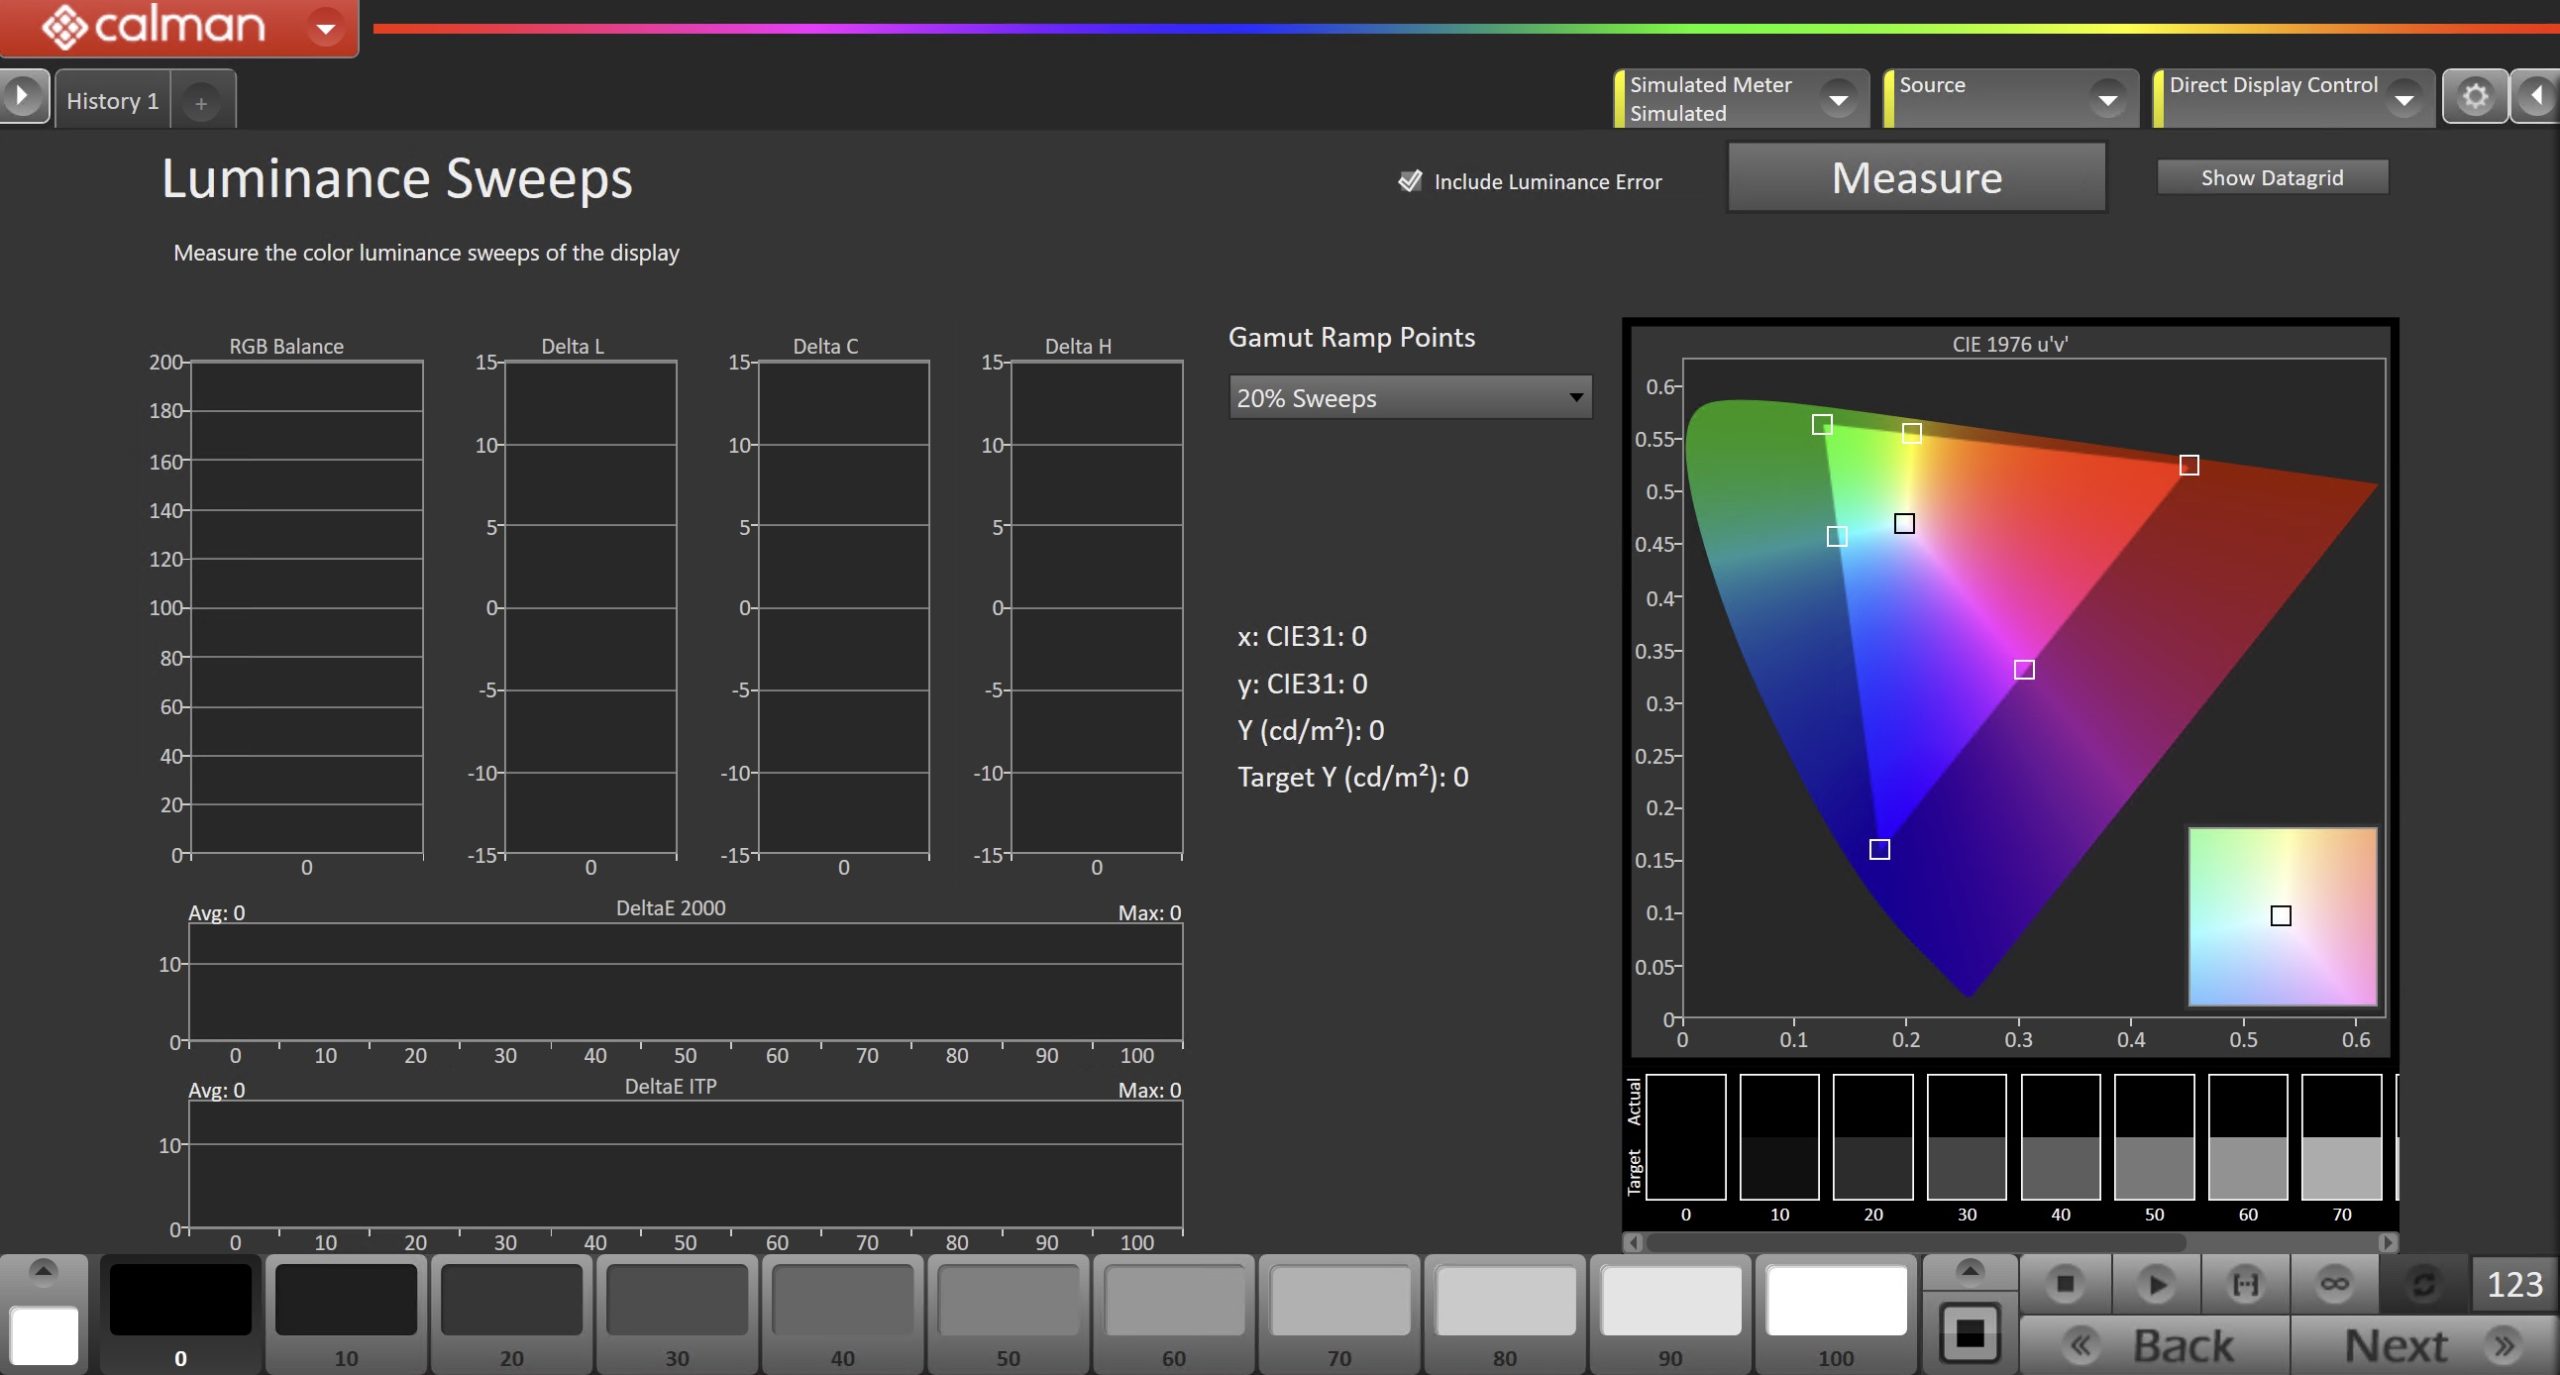
- Set your points in the sweeps (lower percentage equals more points), and click Measure.
ColorChecker
This page will use the X-Rite/Pantone ColorChecker® target colors to evaluate overall color gamut performance
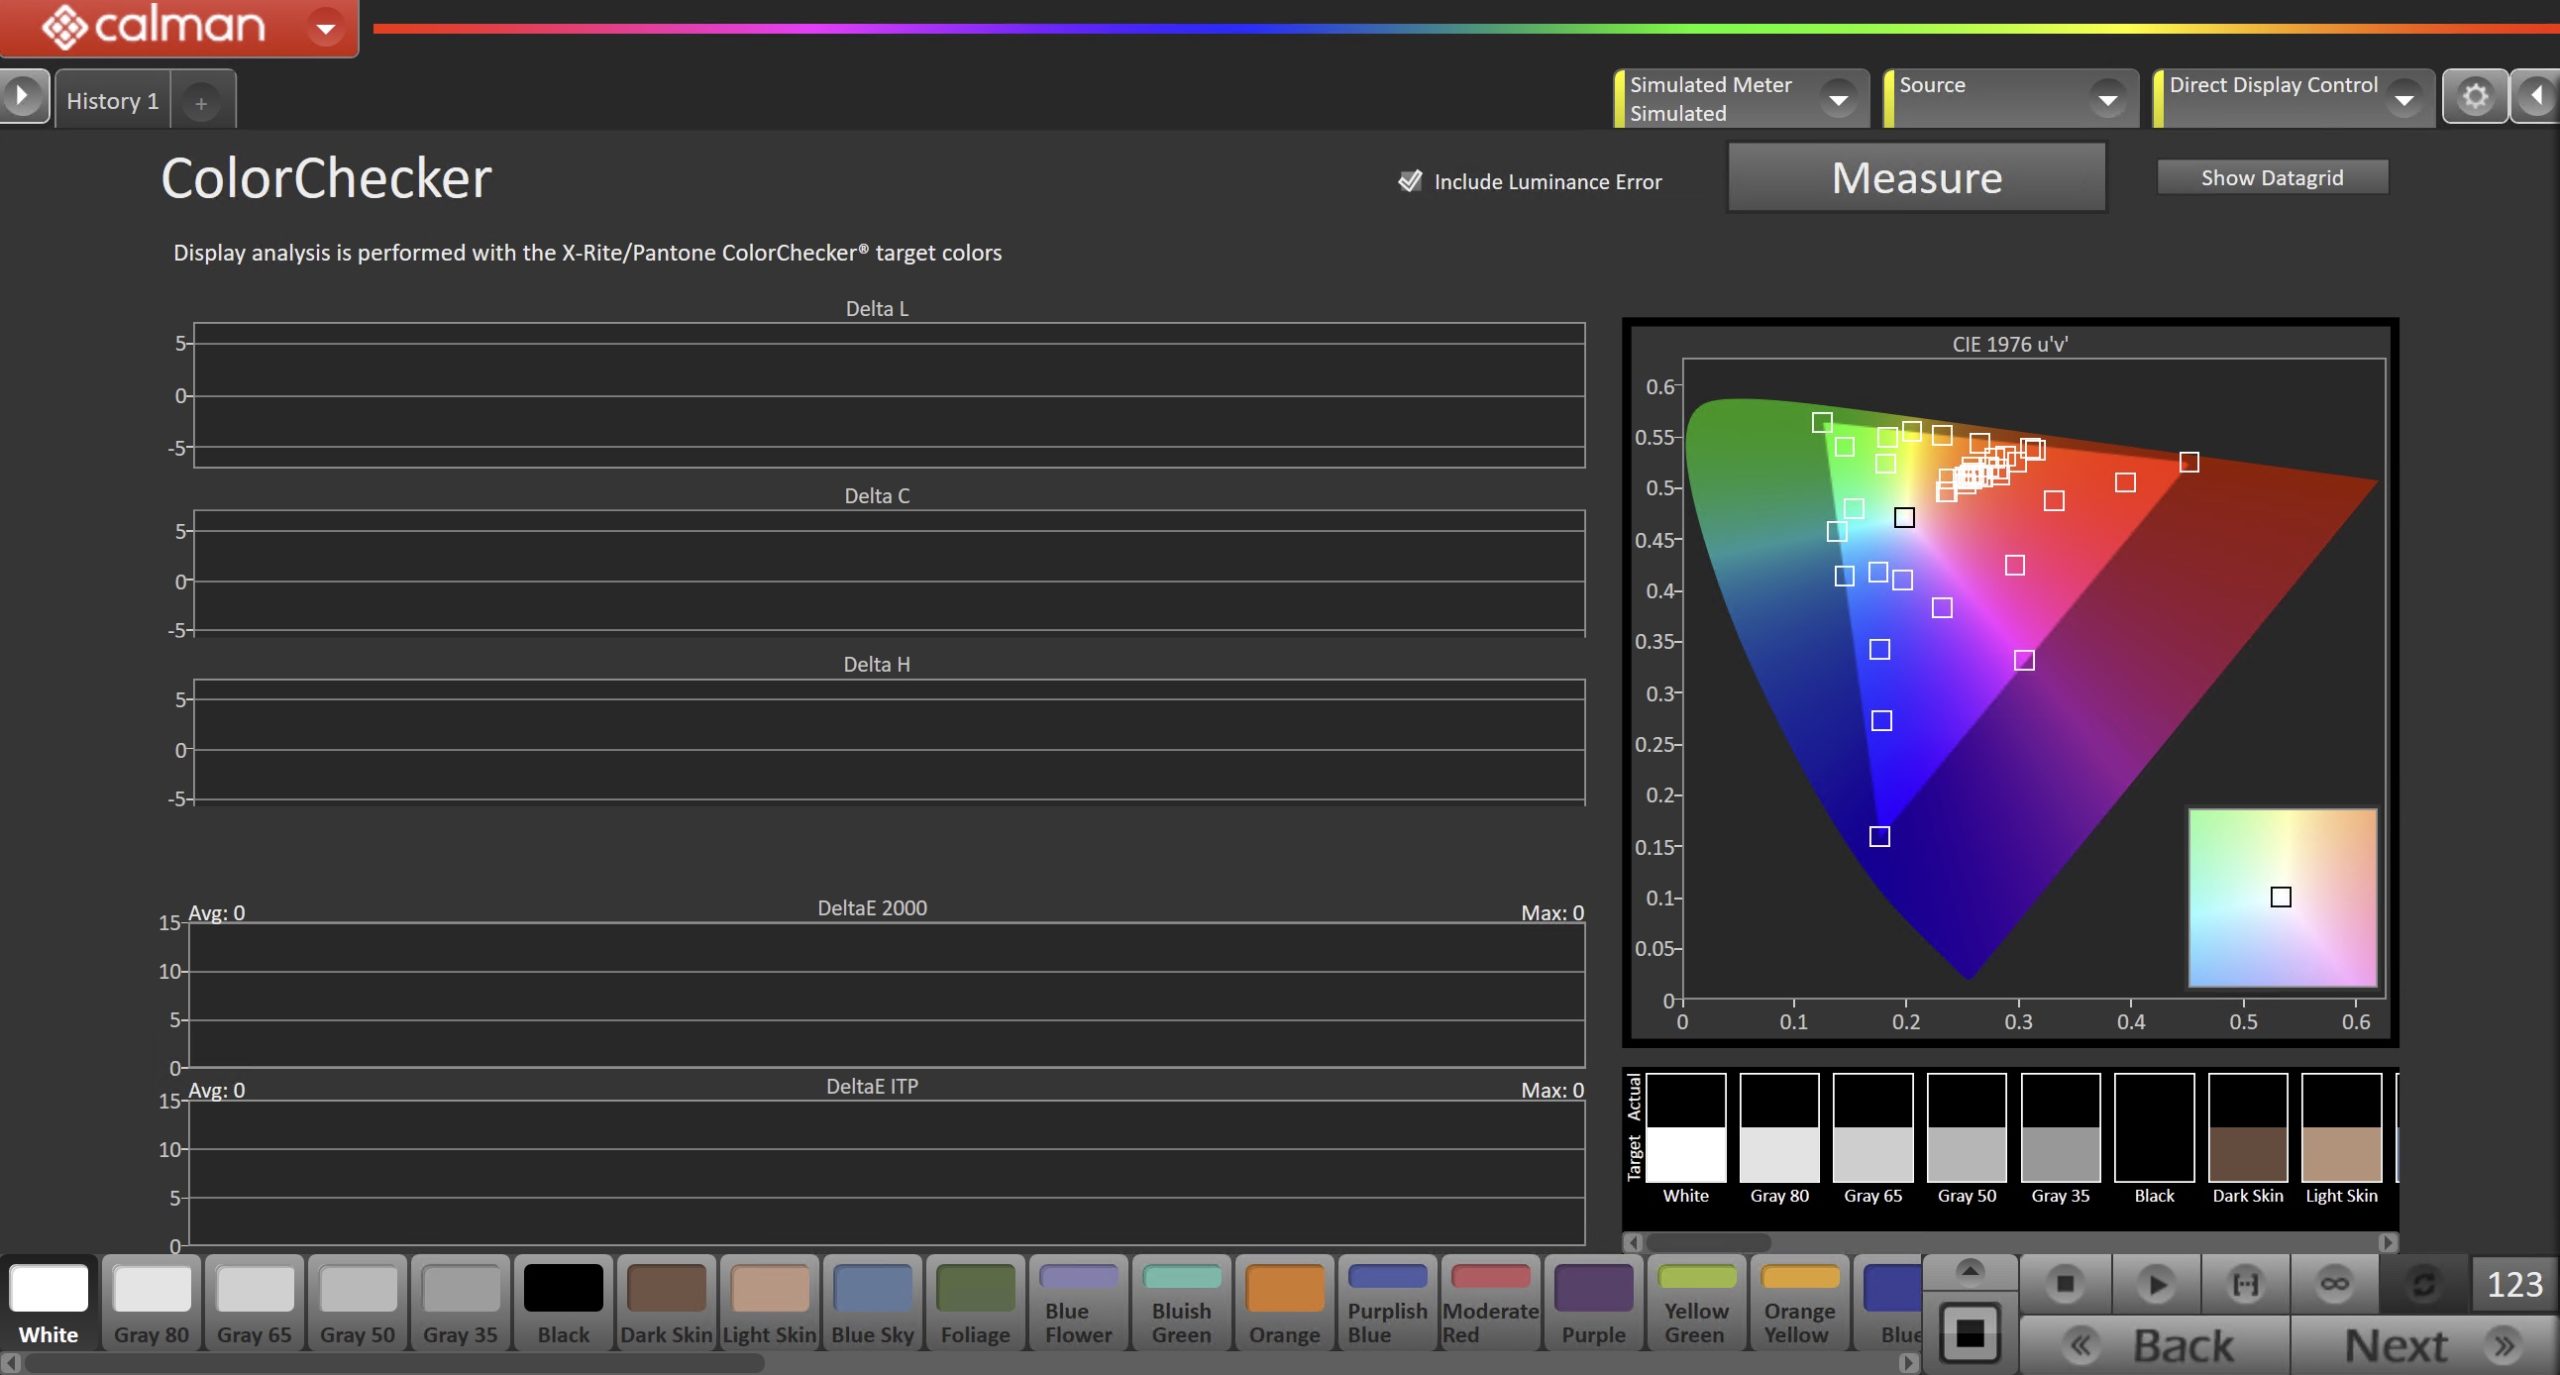
- Click Measure to begin measurement of ColorChecker colors.
HDR Content Colors
This page will use the ColorMatch color set, which uses colors derived from actual HDR video content. We recommend measuring this set with an HDR source.
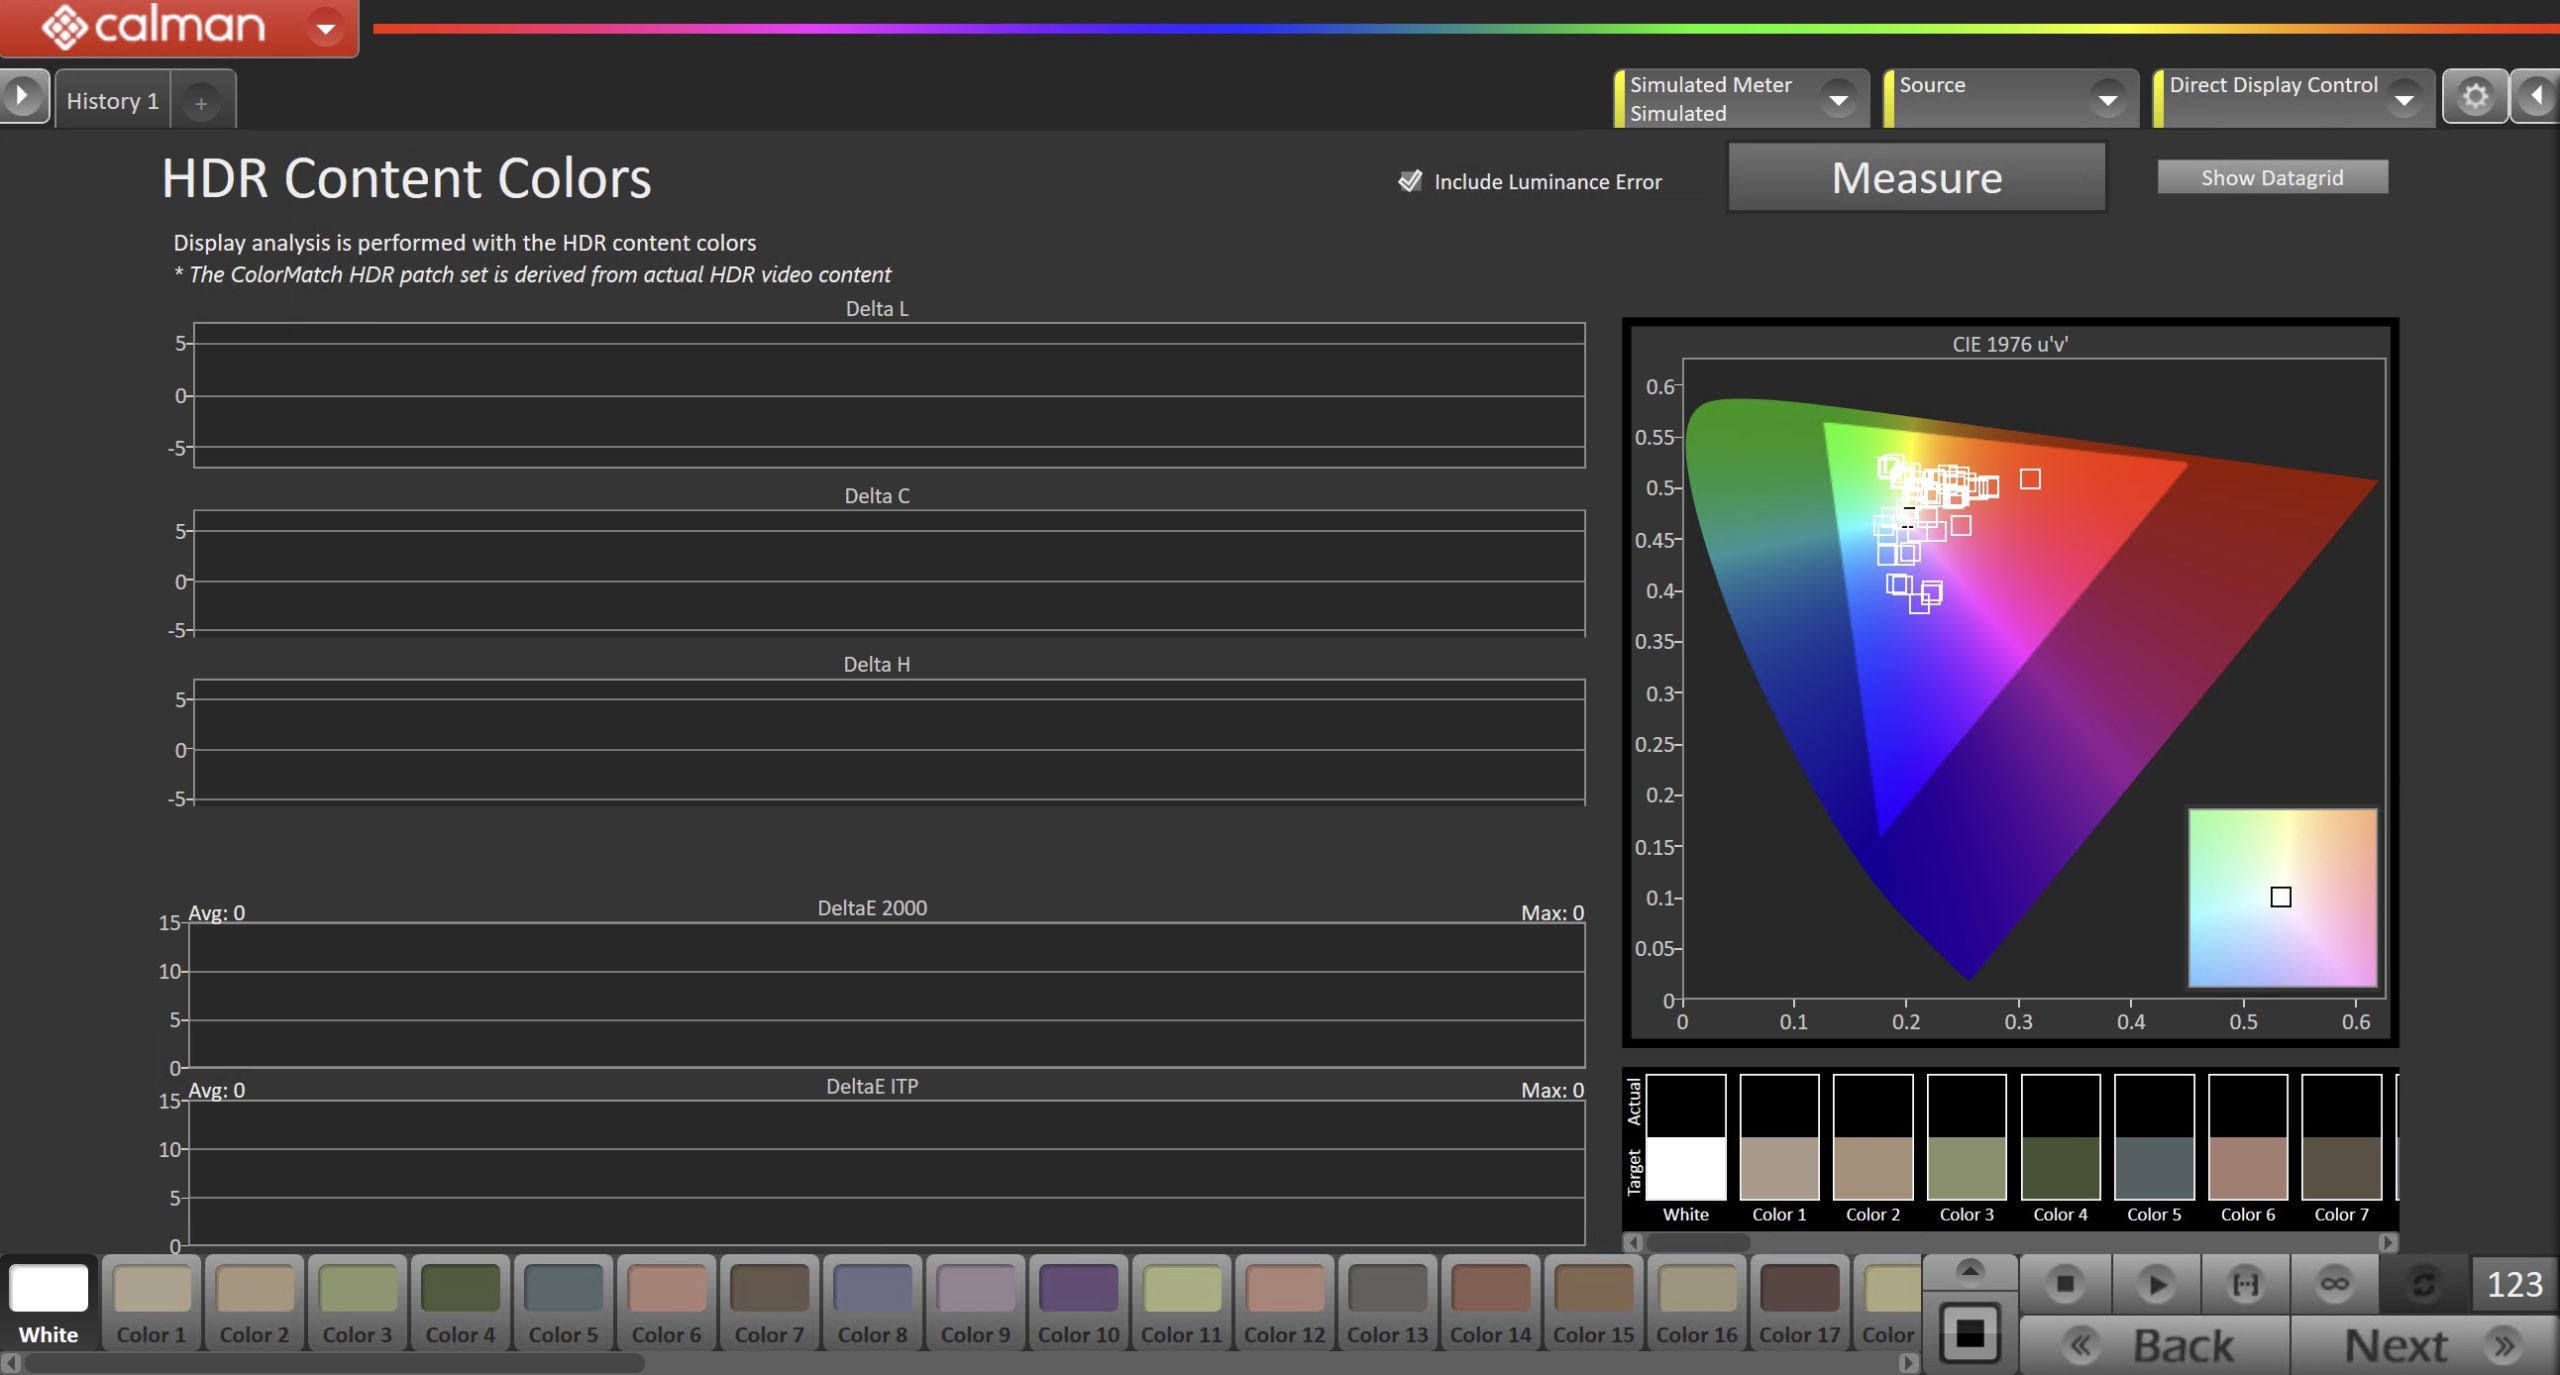
- Click Measure to begin measurement of HDR Content colors.
Peak Luminance vs Window Size
This test makes peak luminance measurements at eight different test pattern window sizes, ranging from a 1% window to 100% full field to evaluate a display’s performance.
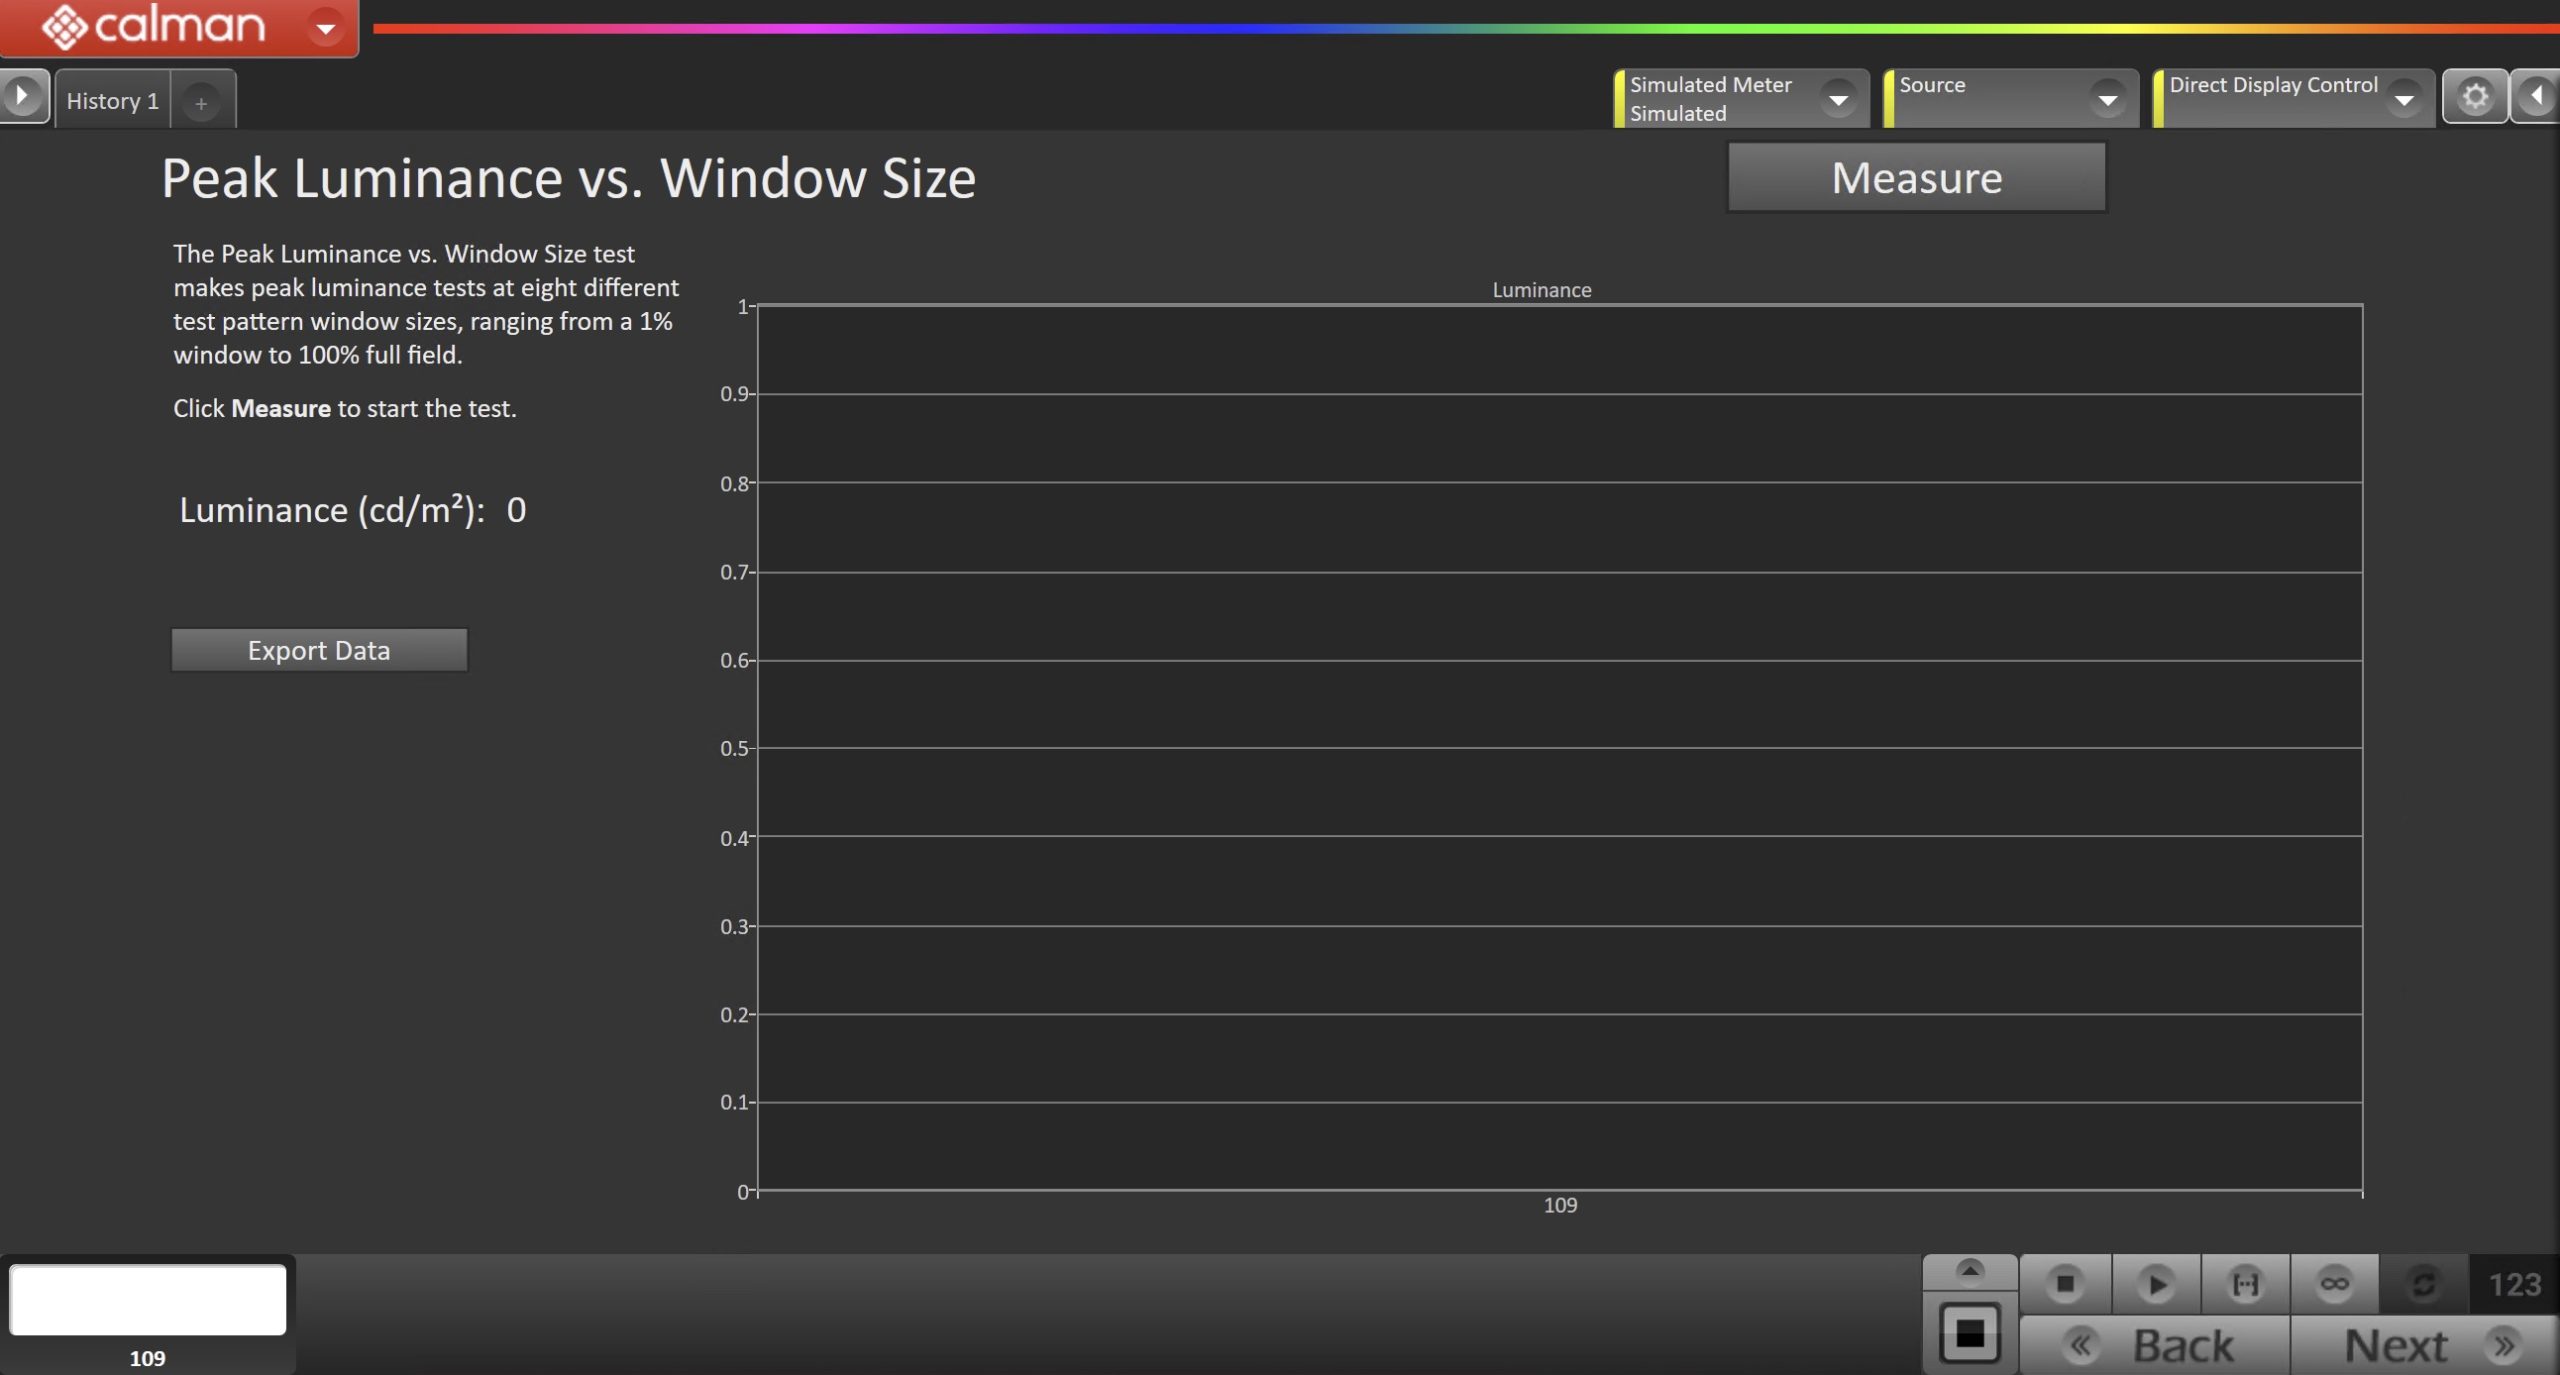
- Click Measure to begin measurement.
Gamut Coverage
This page is used to determine the percentage of the target gamut that is covered by the measured display.

- Select your target gamma using the dropdown at the top-middle of the page, and click Measure to begin measurement.
Color Volume (L*a*b*)
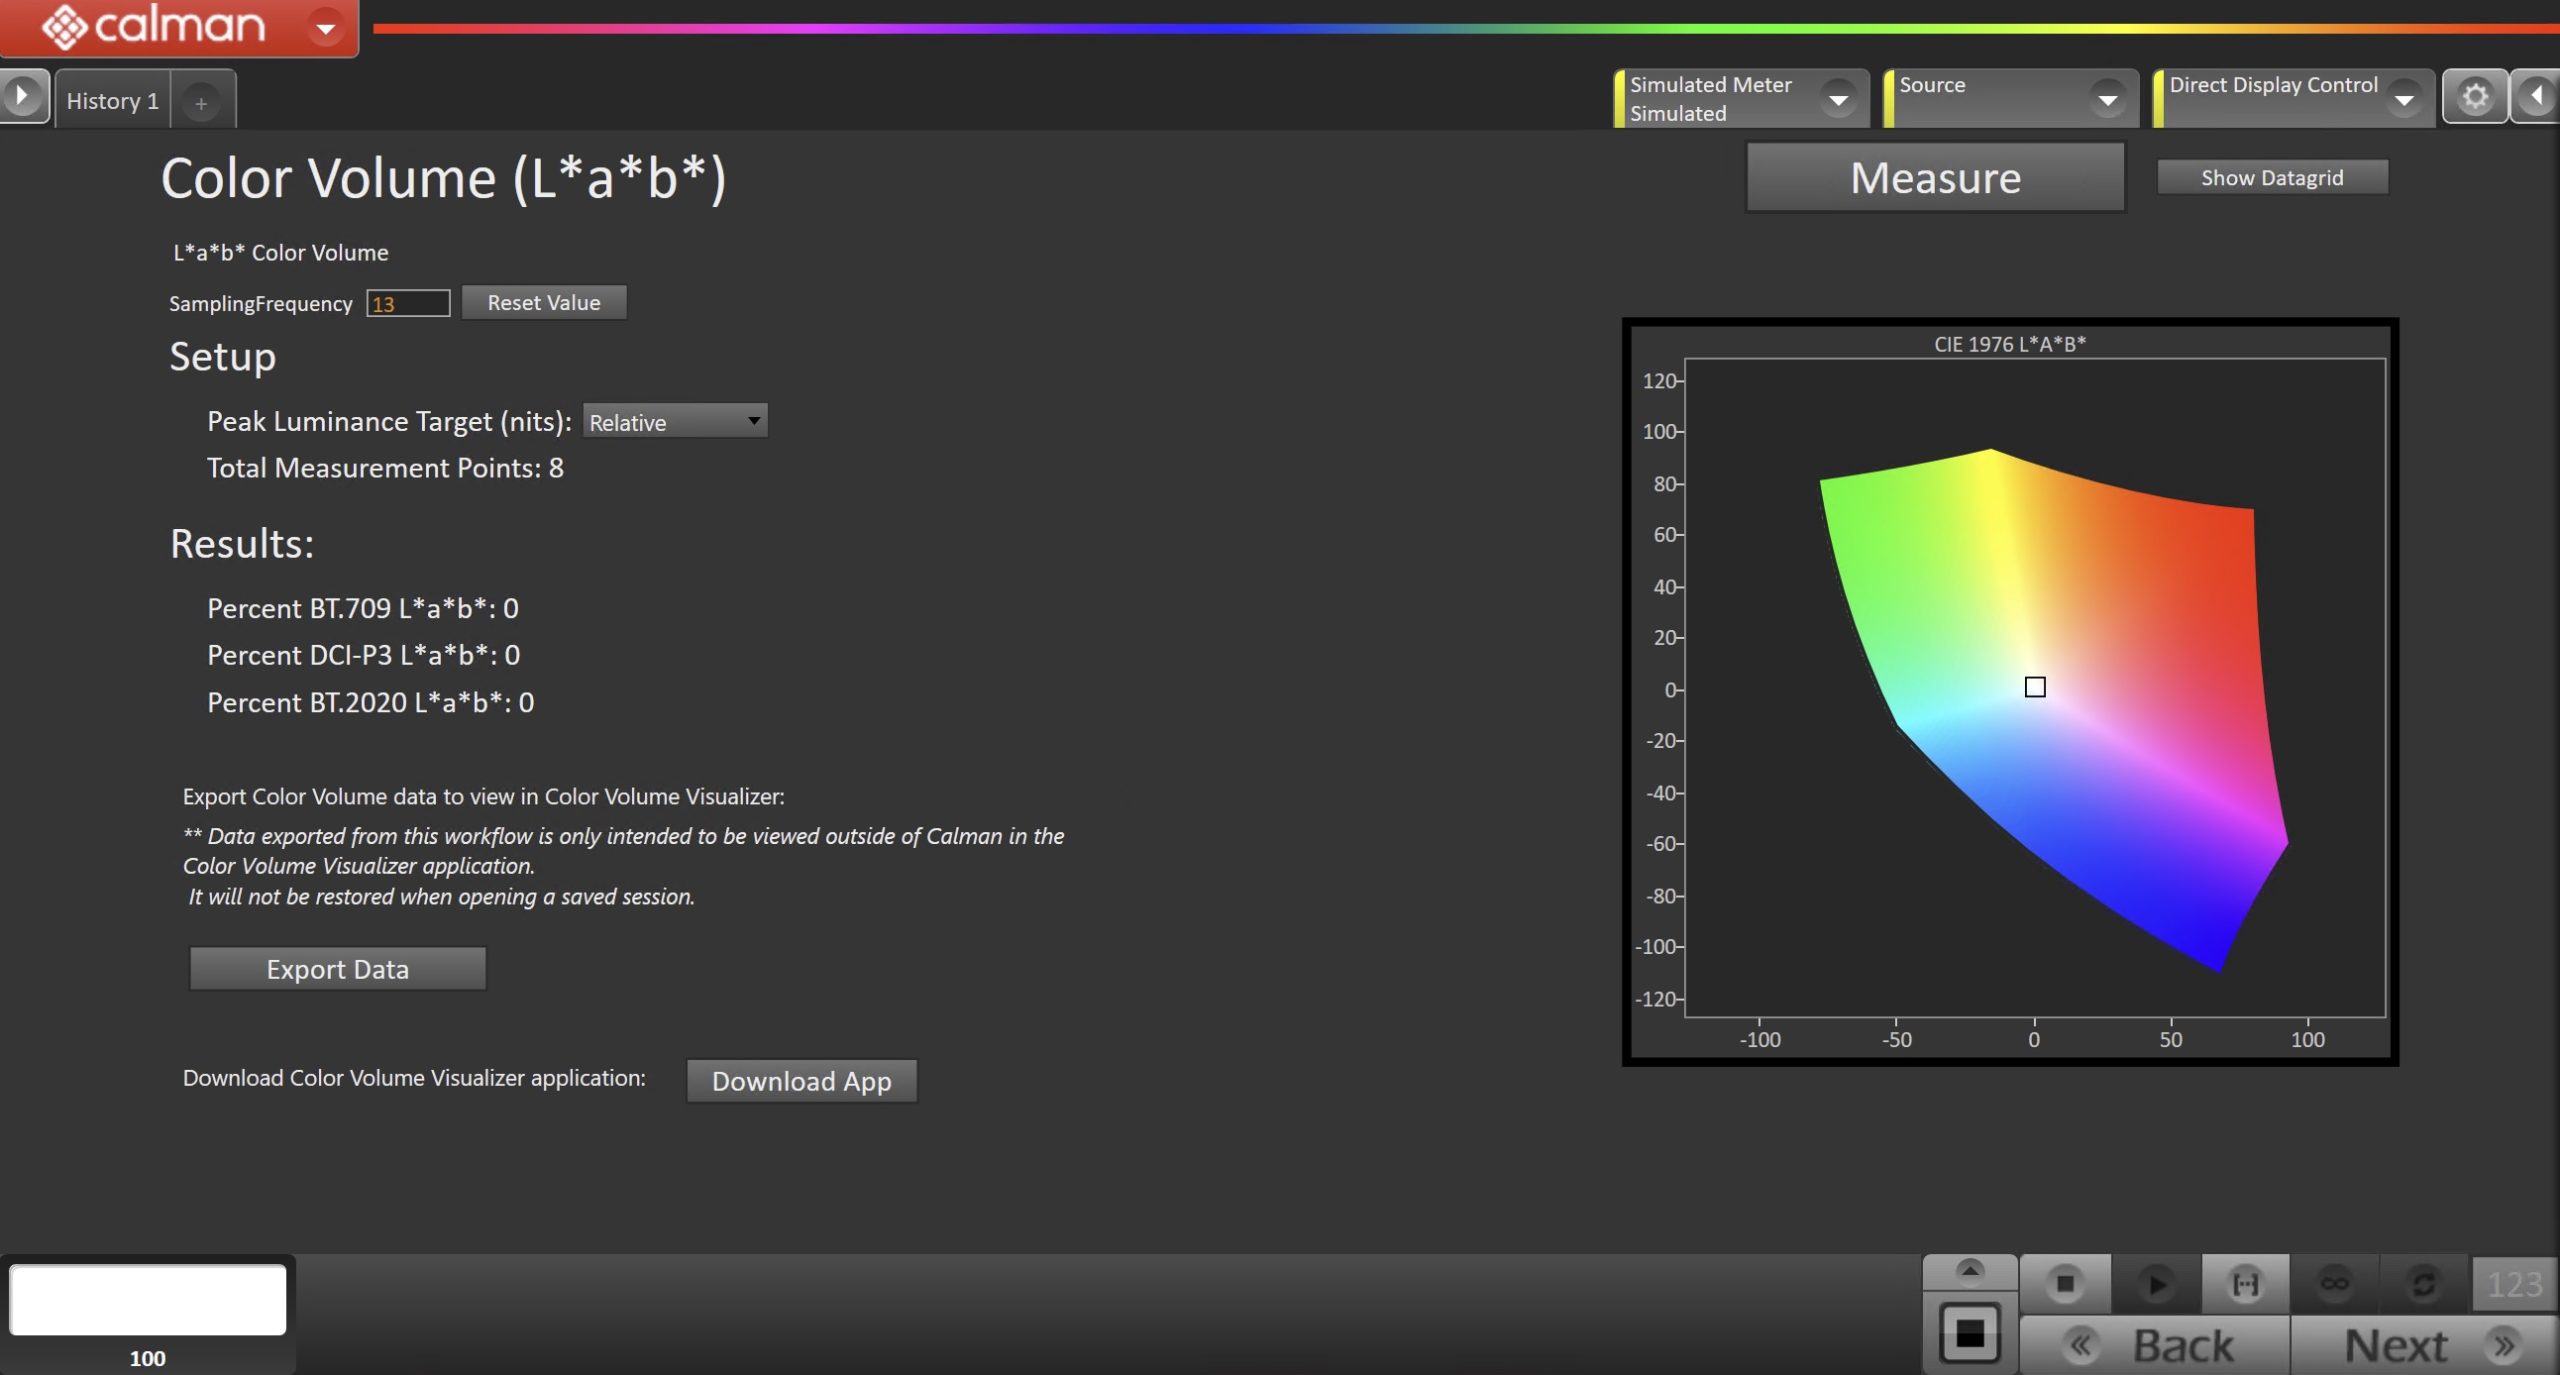
Setup
- Sampling Frequency refers to the number of points used along each access measured.
- For Peak Luminance Target, select 540, 1000, 1500, 2000, 4000, or 10,000 nits if you want to compare the display to a theoretical display of a certain peak luminance.
- Otherwise, select “Relative” to compare the display to a theoretical display with the same peak luminance as the display you are measuring.
- The number of total measurement points will be indicated.
Results
The results of the CIE L*a*b* Color Volume analysis are shown in terms of the percentage of the calculated color volume to the BT.709, DCI-P3, and BT.2020 color volumes.
Color Volume Visualizer
- When the CIE L*a*b* Color Volume measurement is complete, you can export the measurement data and view it in the Color Volume Visualizer application. Currently, the Color Volume Visualizer is compatible only with the “Relative” CIE L*a*b* measurement type.
To view the measured color volume:
- At the bottom of the CIE L*a*b* Color Volume page, click the Export Data button.
- Edit the name of the file, if desired, and save the .csv file to a convenient directory location.
- Click the Download App button to download the Color Volume Visualizer.exe file. Copy the executable file to a convenient location.
- Run the Color Volume Visualizer.exe file.
- On the Color Volume Visualizer screen (Figure 3), under File, click “Open” and navigate to the .csv data file that you previously saved.
- When you open the .csv file, the CIE L*a*b* color volume of the display that you measured will be plotted as a 3D volume. You can grab the plot and rotate it to any desired orientation.
Color Volume (ICtCp)
This metric is based on the ICtCp color space, included in ITU-R BT.2100. ICtCp is an absolute color space that was designed specifically for high dynamic range (up to 10,000 nits) and wide color gamut (BT.2020) images. It describes perceptually uniform JNDs over a wide range of luminance and colors. ICtCp can be used to determine the total number of distinguishable colors that can be rendered by a display throughout its entire color volume.
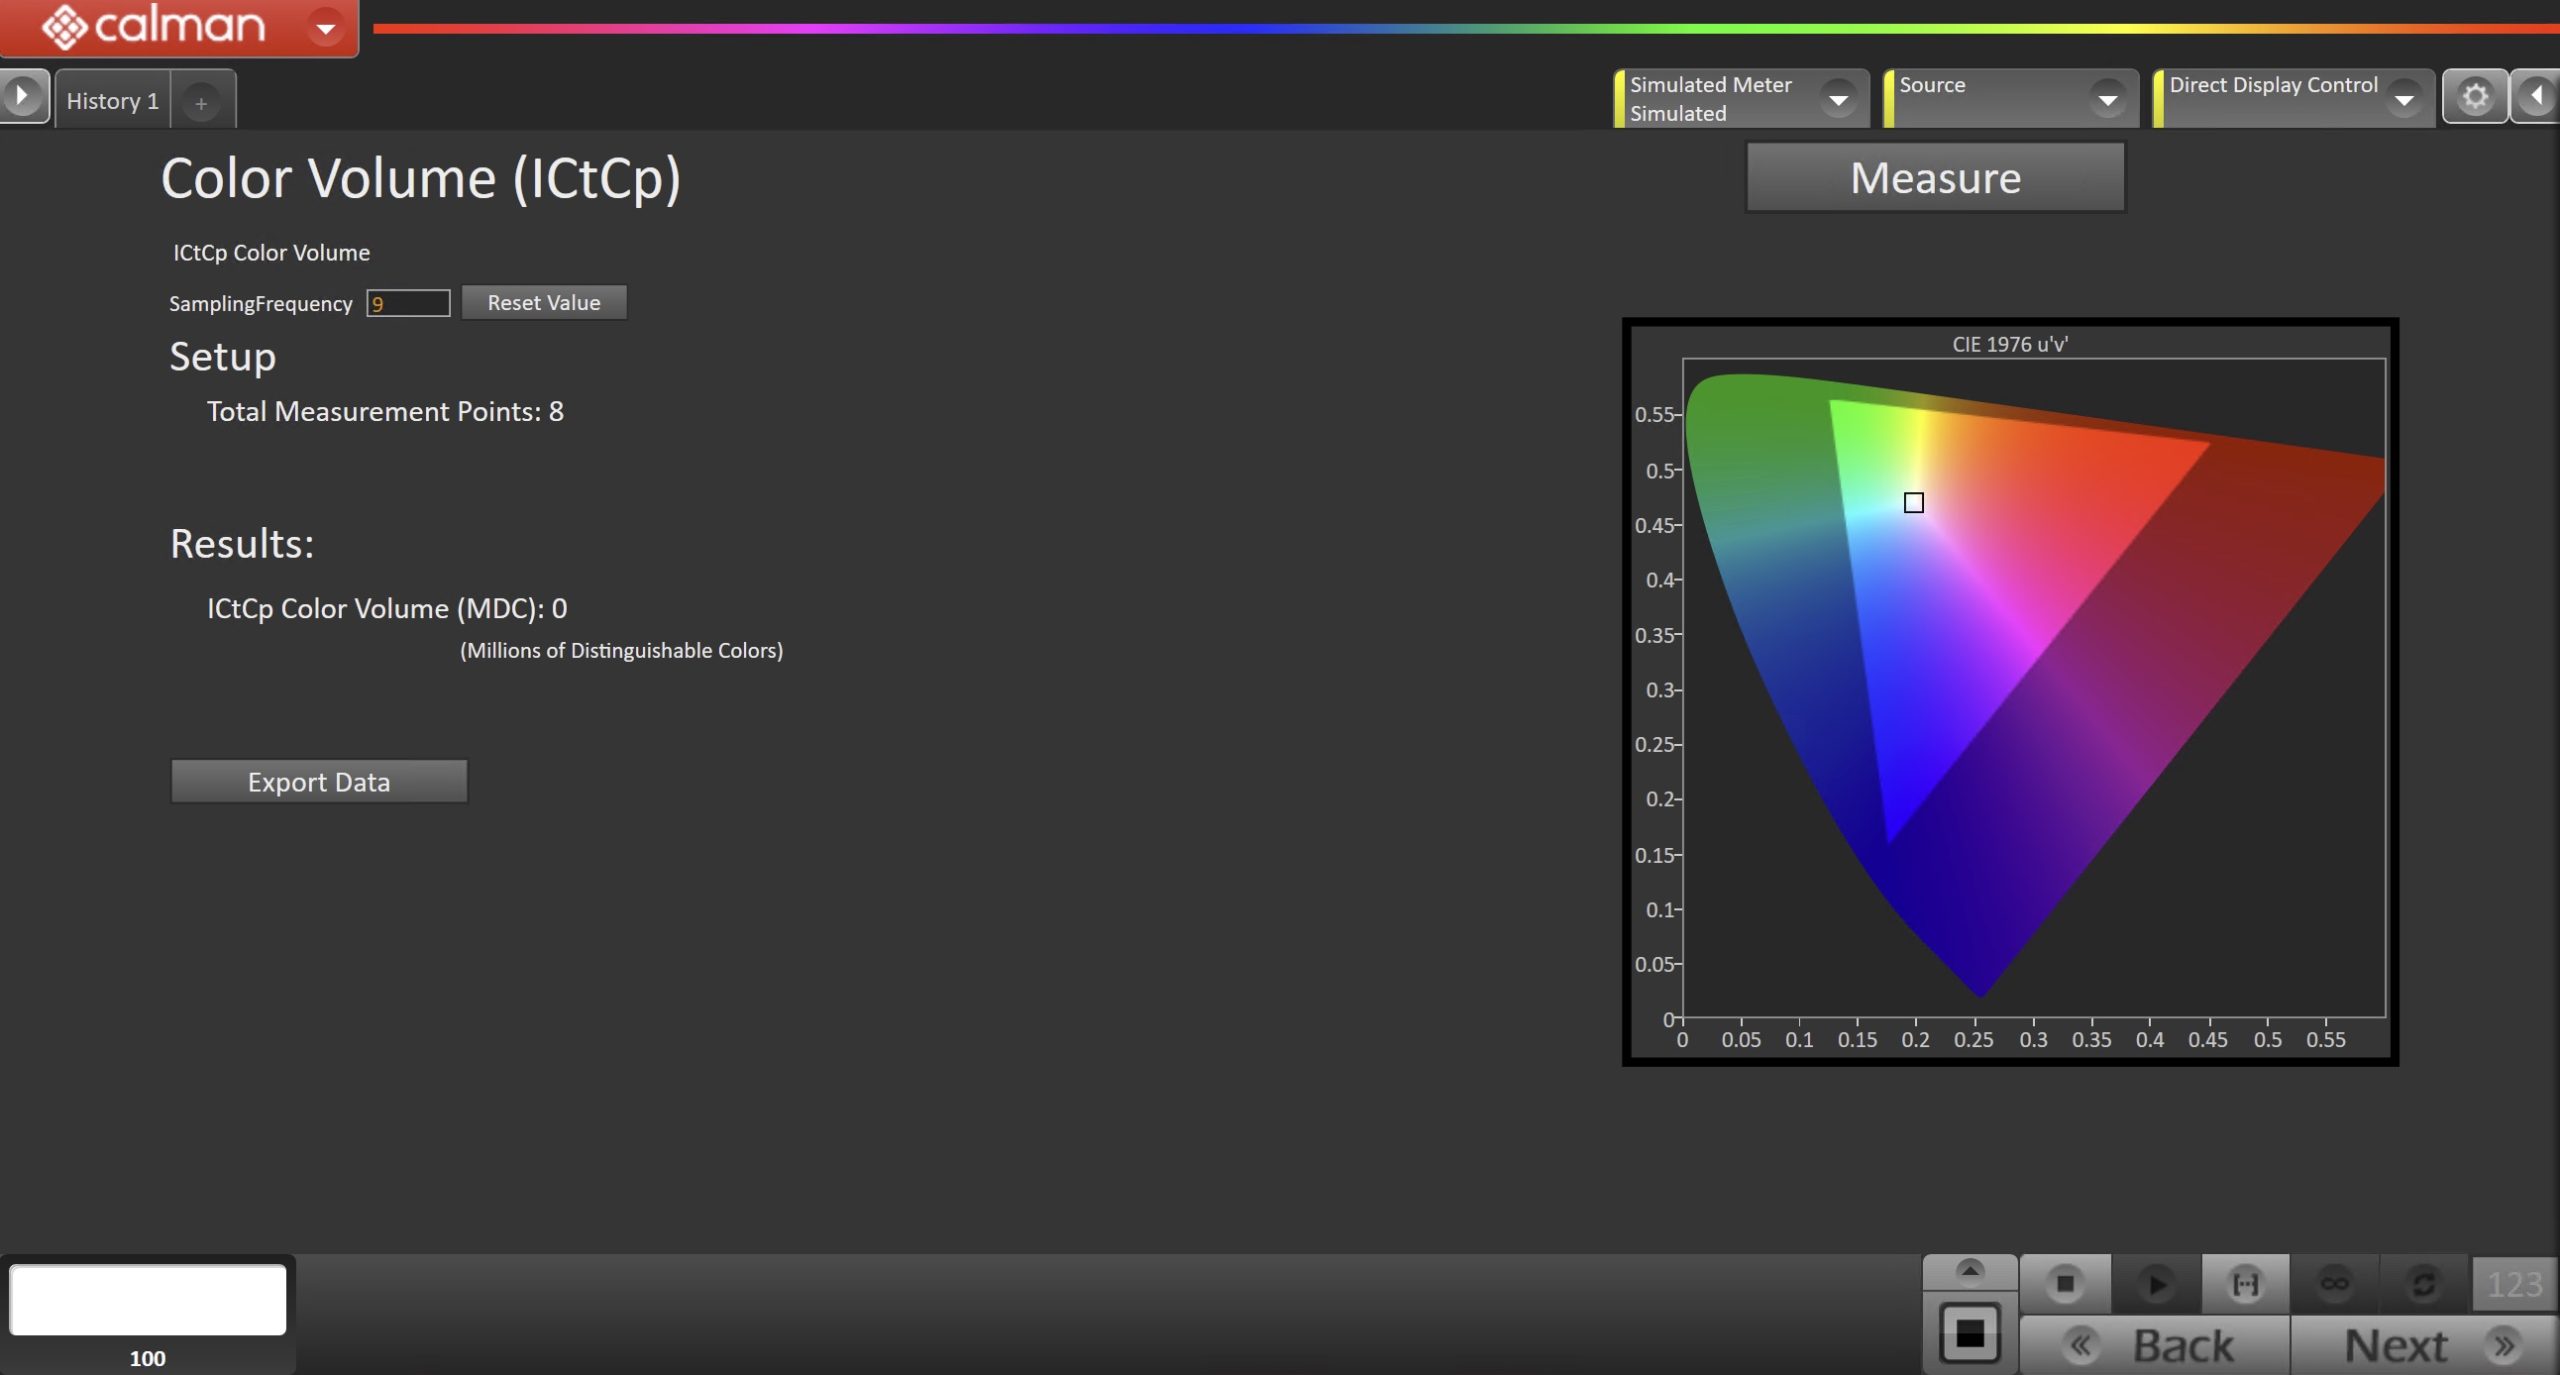
Setup
- Sampling Frequency refers to the number of points used along each access measured.
- The number of total measurement points will be indicated.
Results
- The results of the ICtCp Color Volume analysis is shown in terms of the millions of distinguishable colors (MDC) able to be rendered by the display.
Gamut Rings
Calman’s Gamut Rings layout provides a way to visualize three-dimensional gamut volume as a series of rings in two dimensions. By industry standard, the CIE L*a*b* color space is used. Since this color space provides some predictors of color appearance (lightness, chroma, and hue), it allows us to quantify gamut volume in perceptually meaningful ways. A display’s white point changes how color is perceived, so comparisons are made to the same illuminant (D50 in the device-independent colorspace).
For more info, see: Using Gamut Rings to analyze color volume
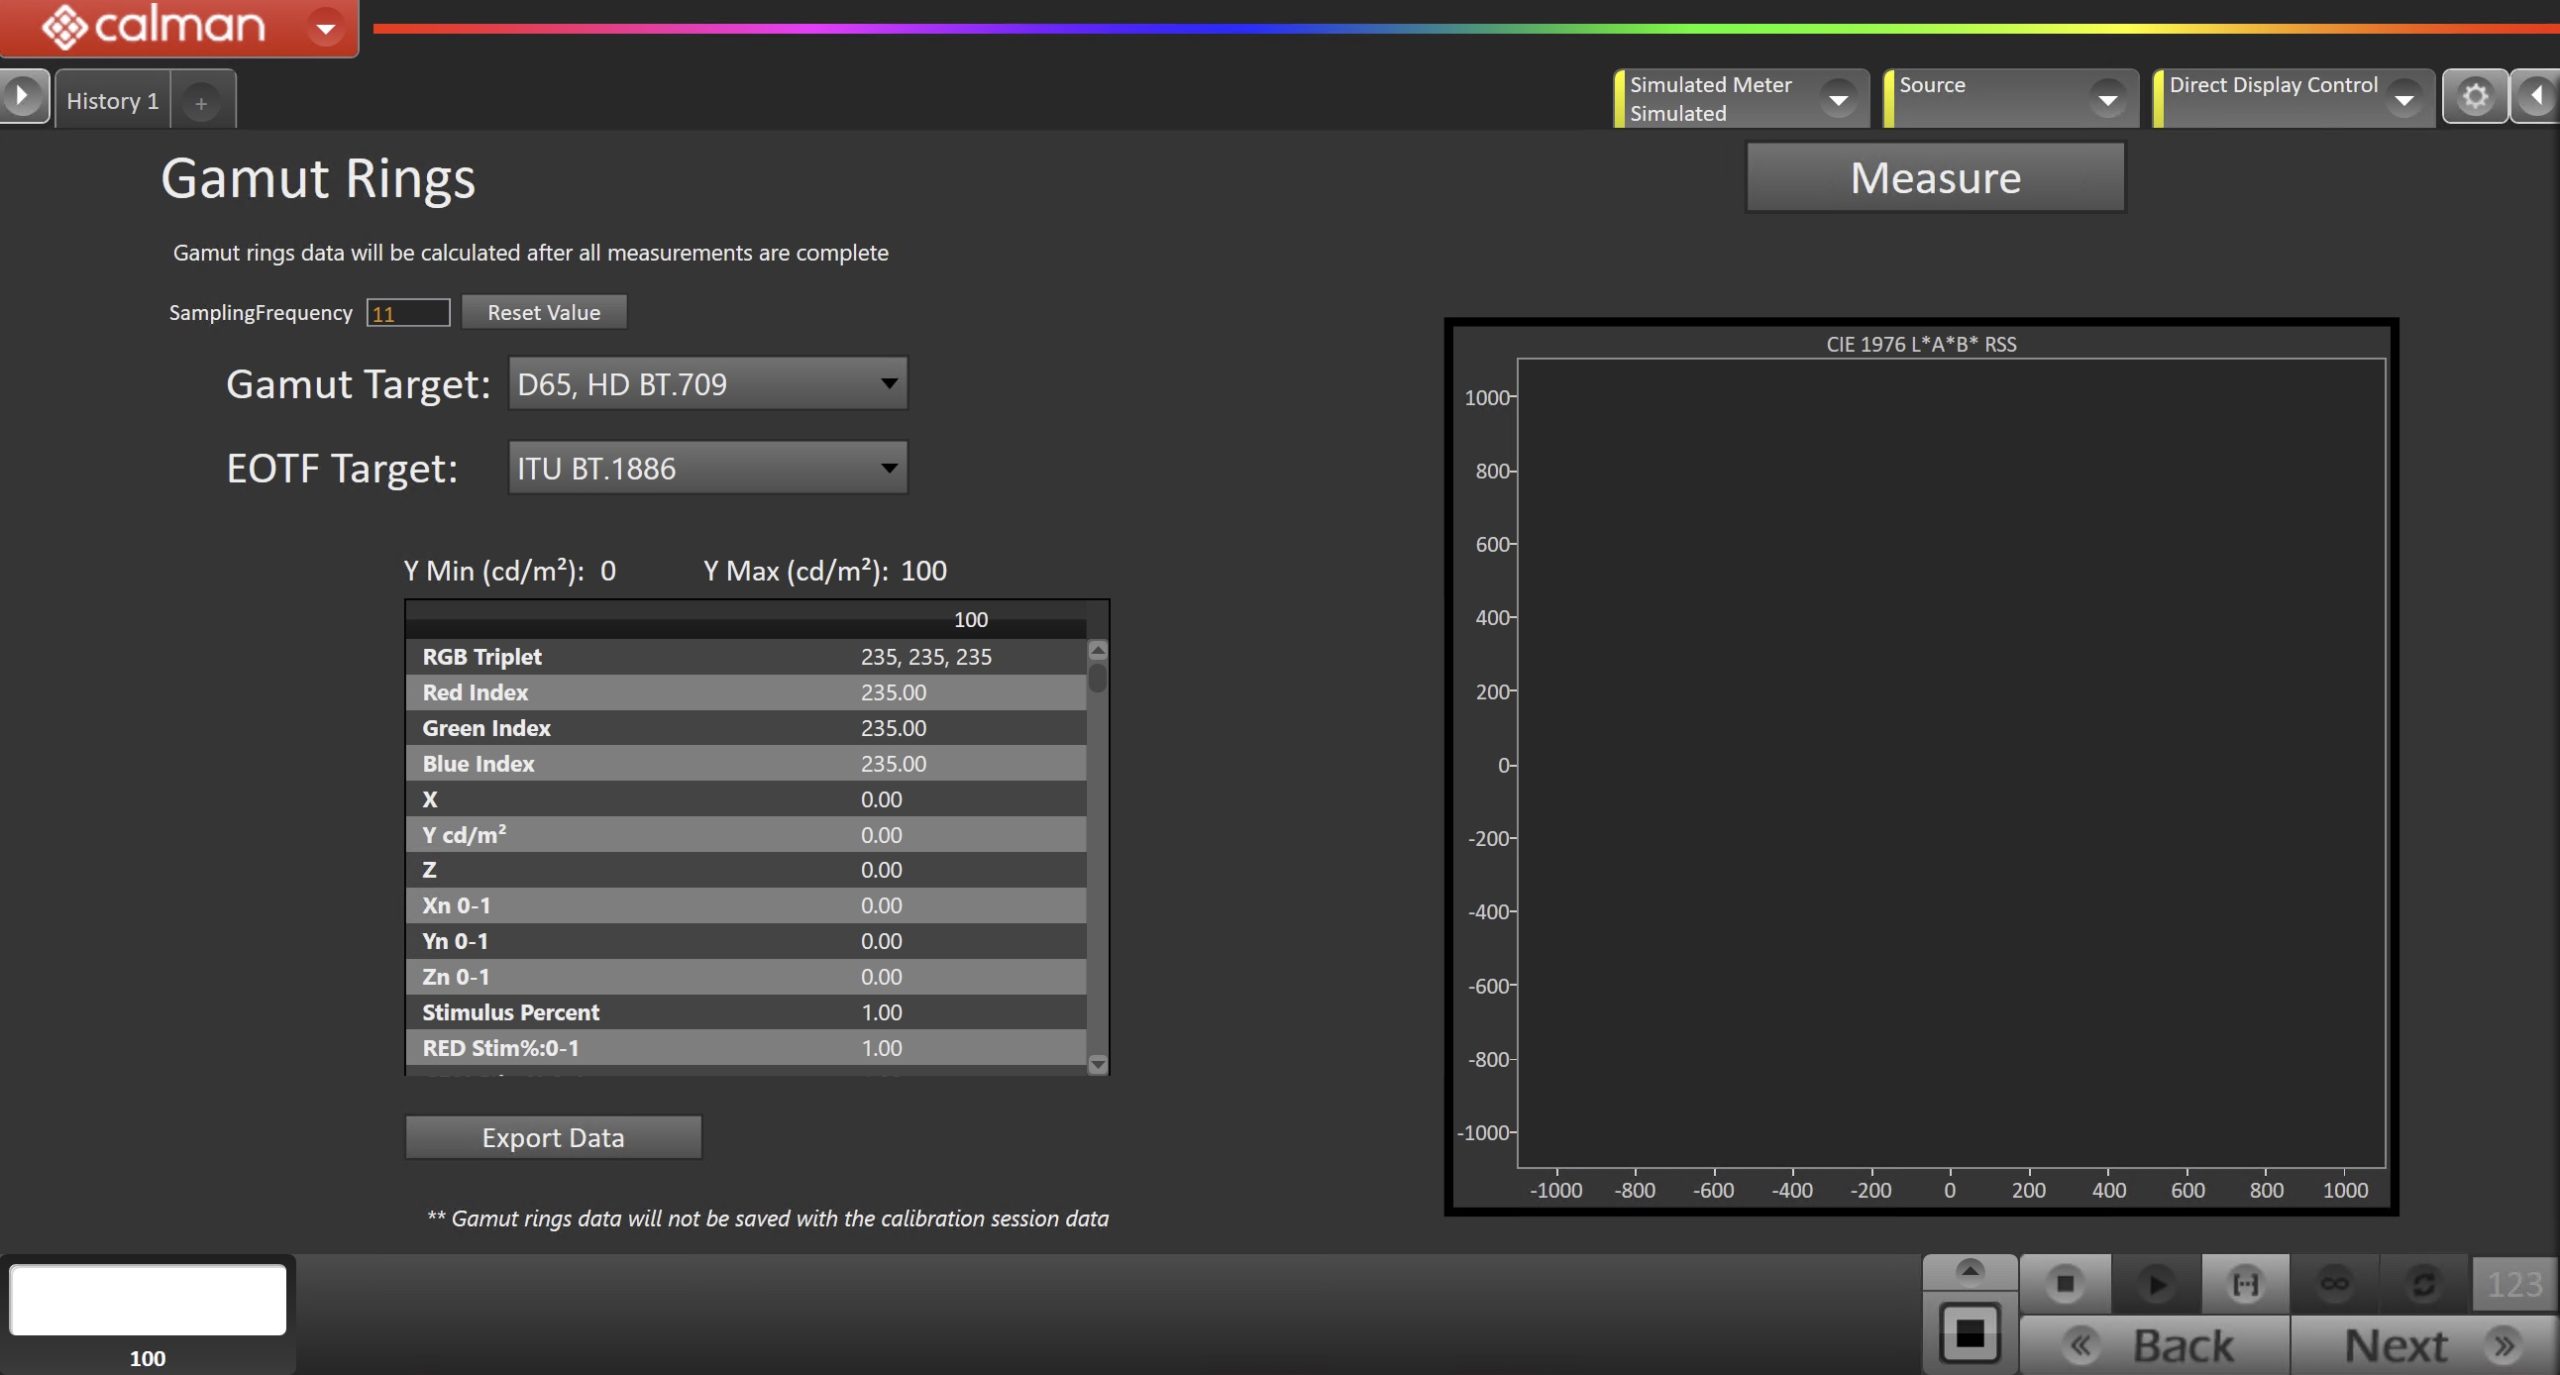
- Set Sampling Frequency (chart resolution/detail level)
- Sampling Frequency refers to the number of points used along each access measured.
- Set Workflow Gamut & EOTF Target
- Gamut Target – Click on the drop-down button to select a target color space
- EOTF Target – Click on the drop-down button to select a target EOTF
- Measure
- Click the measure button to capture data for your display source used for gamut rings comparison. By default, 602 patches will be measured.
- (Optional) Export Gamut Rings Data
- Click on the “Export Gamut Rings Data” button to export your captured data.
- Note: Gamut ring data will not be saved with the calibration session data
- Click on the “Export Gamut Rings Data” button to export your captured data.
Spectral Power Distribution
This page can be used with a Spectroradiometer to measure a display’s spectral response. These measurements cannot be taken with a colorimeter.
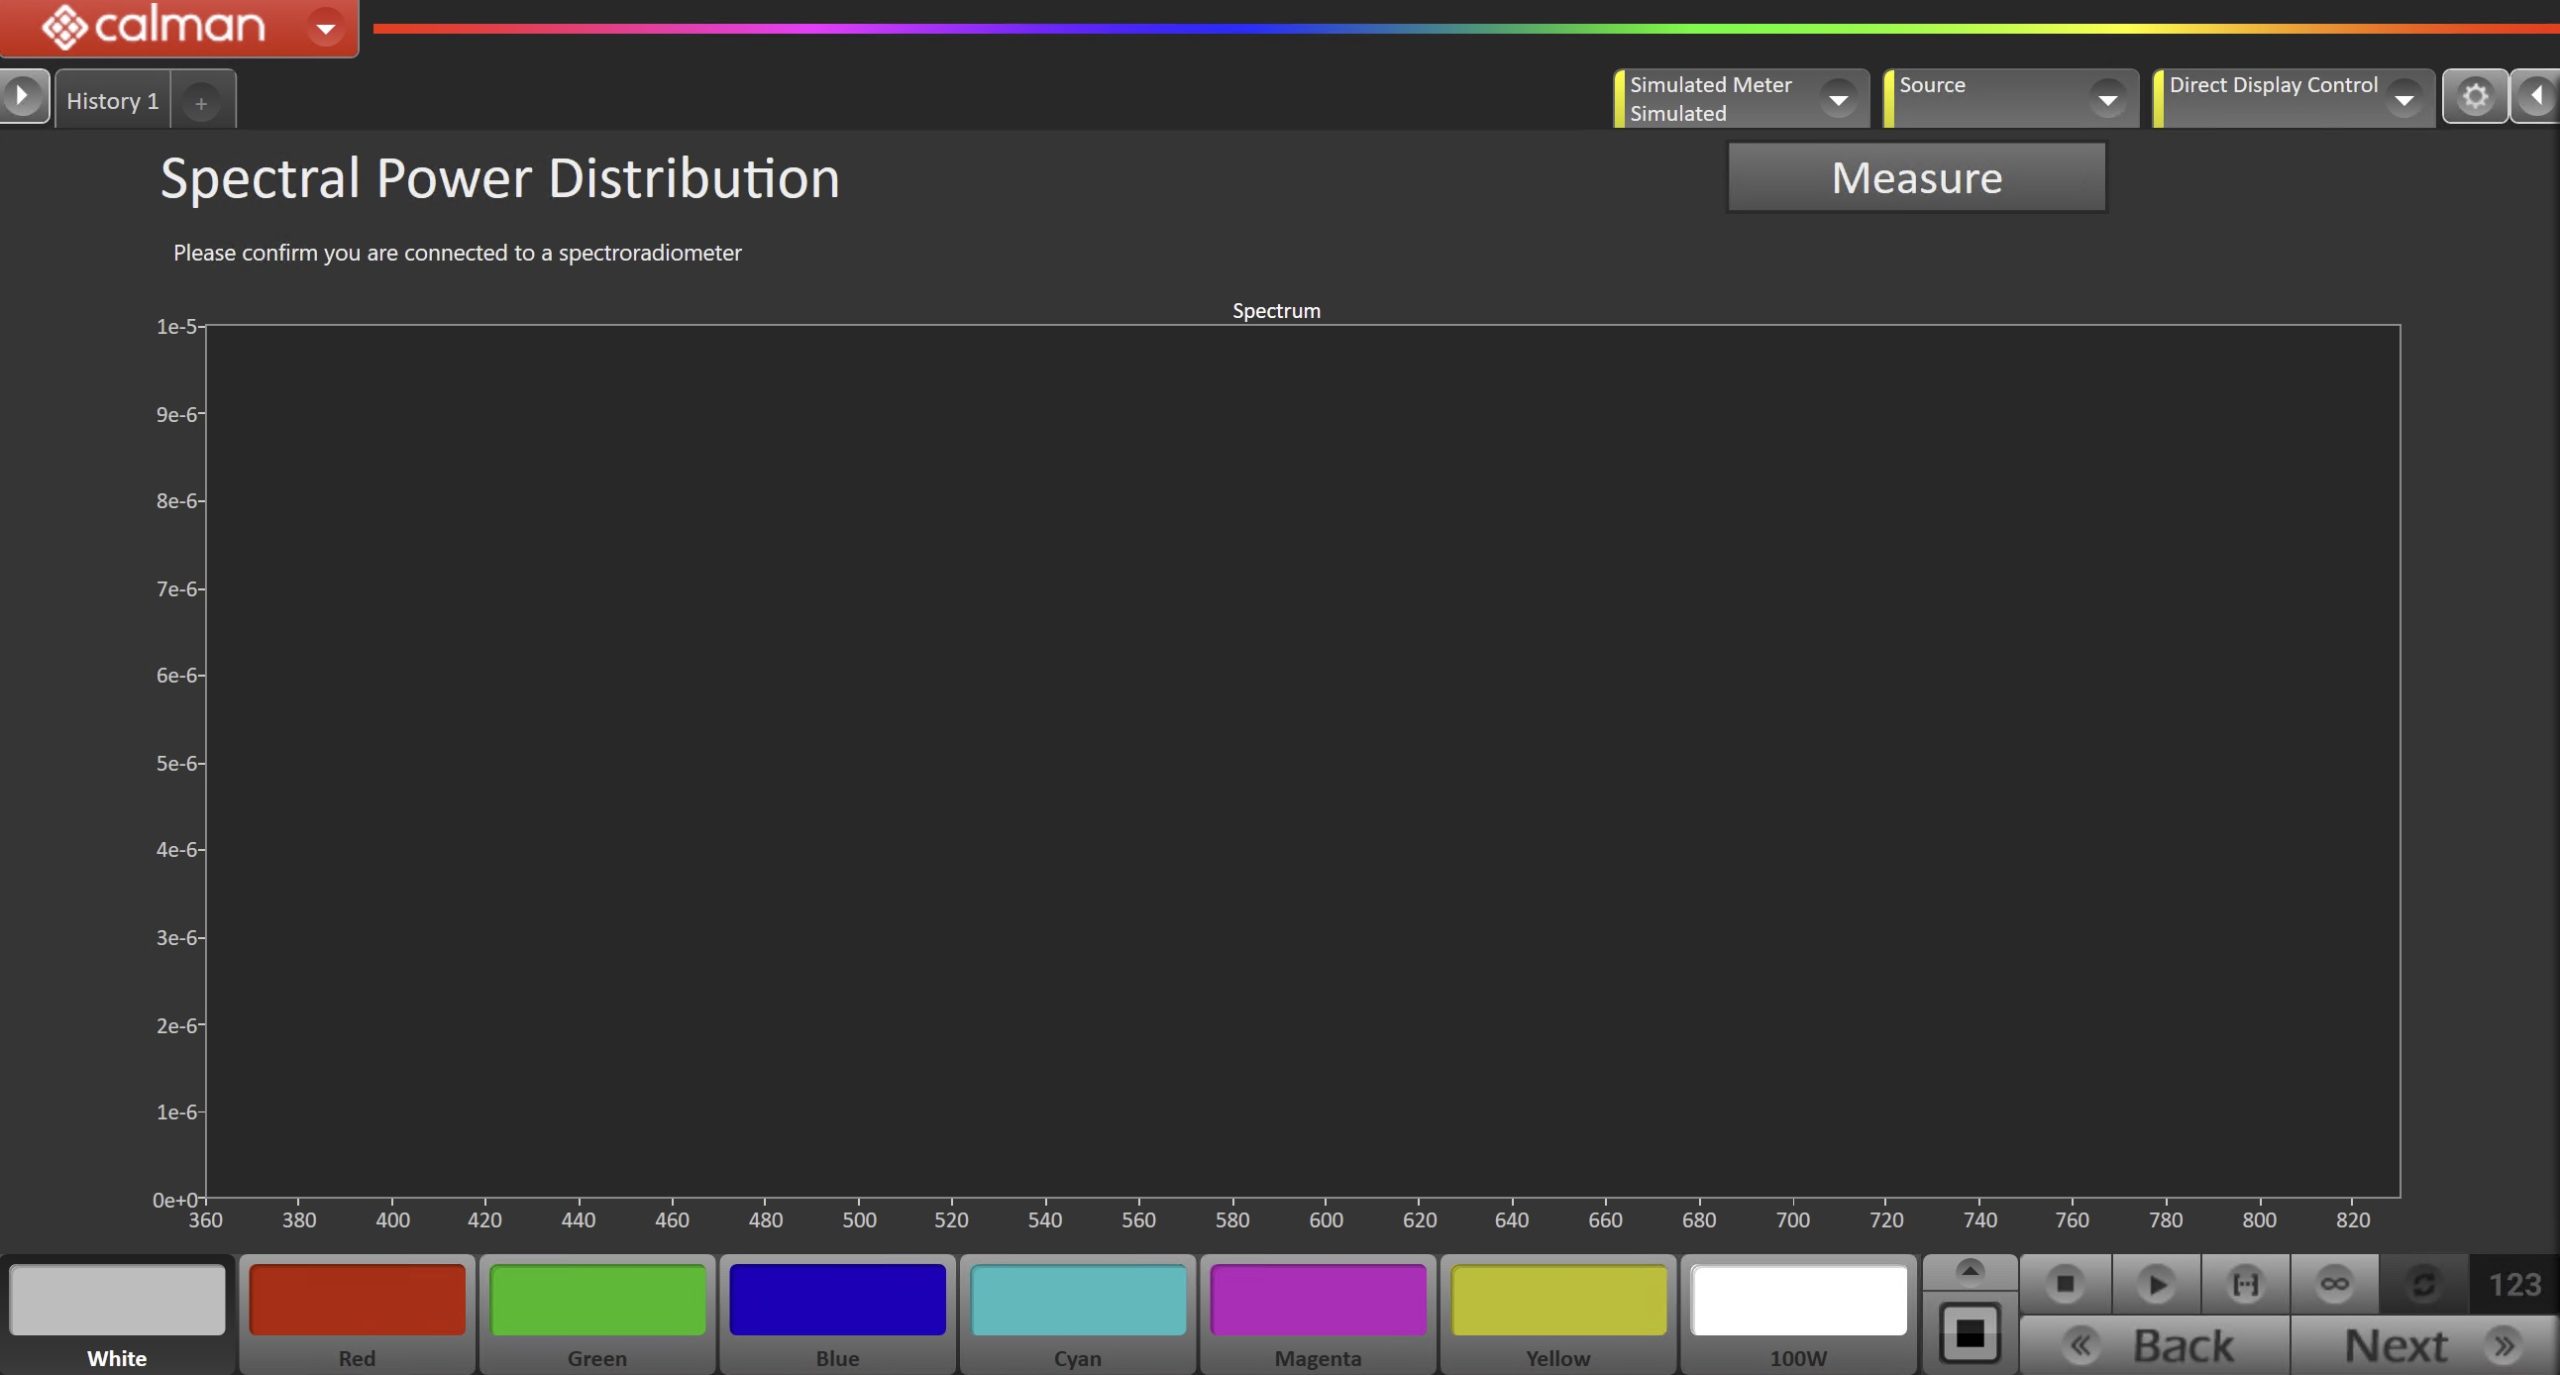
- Click Read Series to measure.
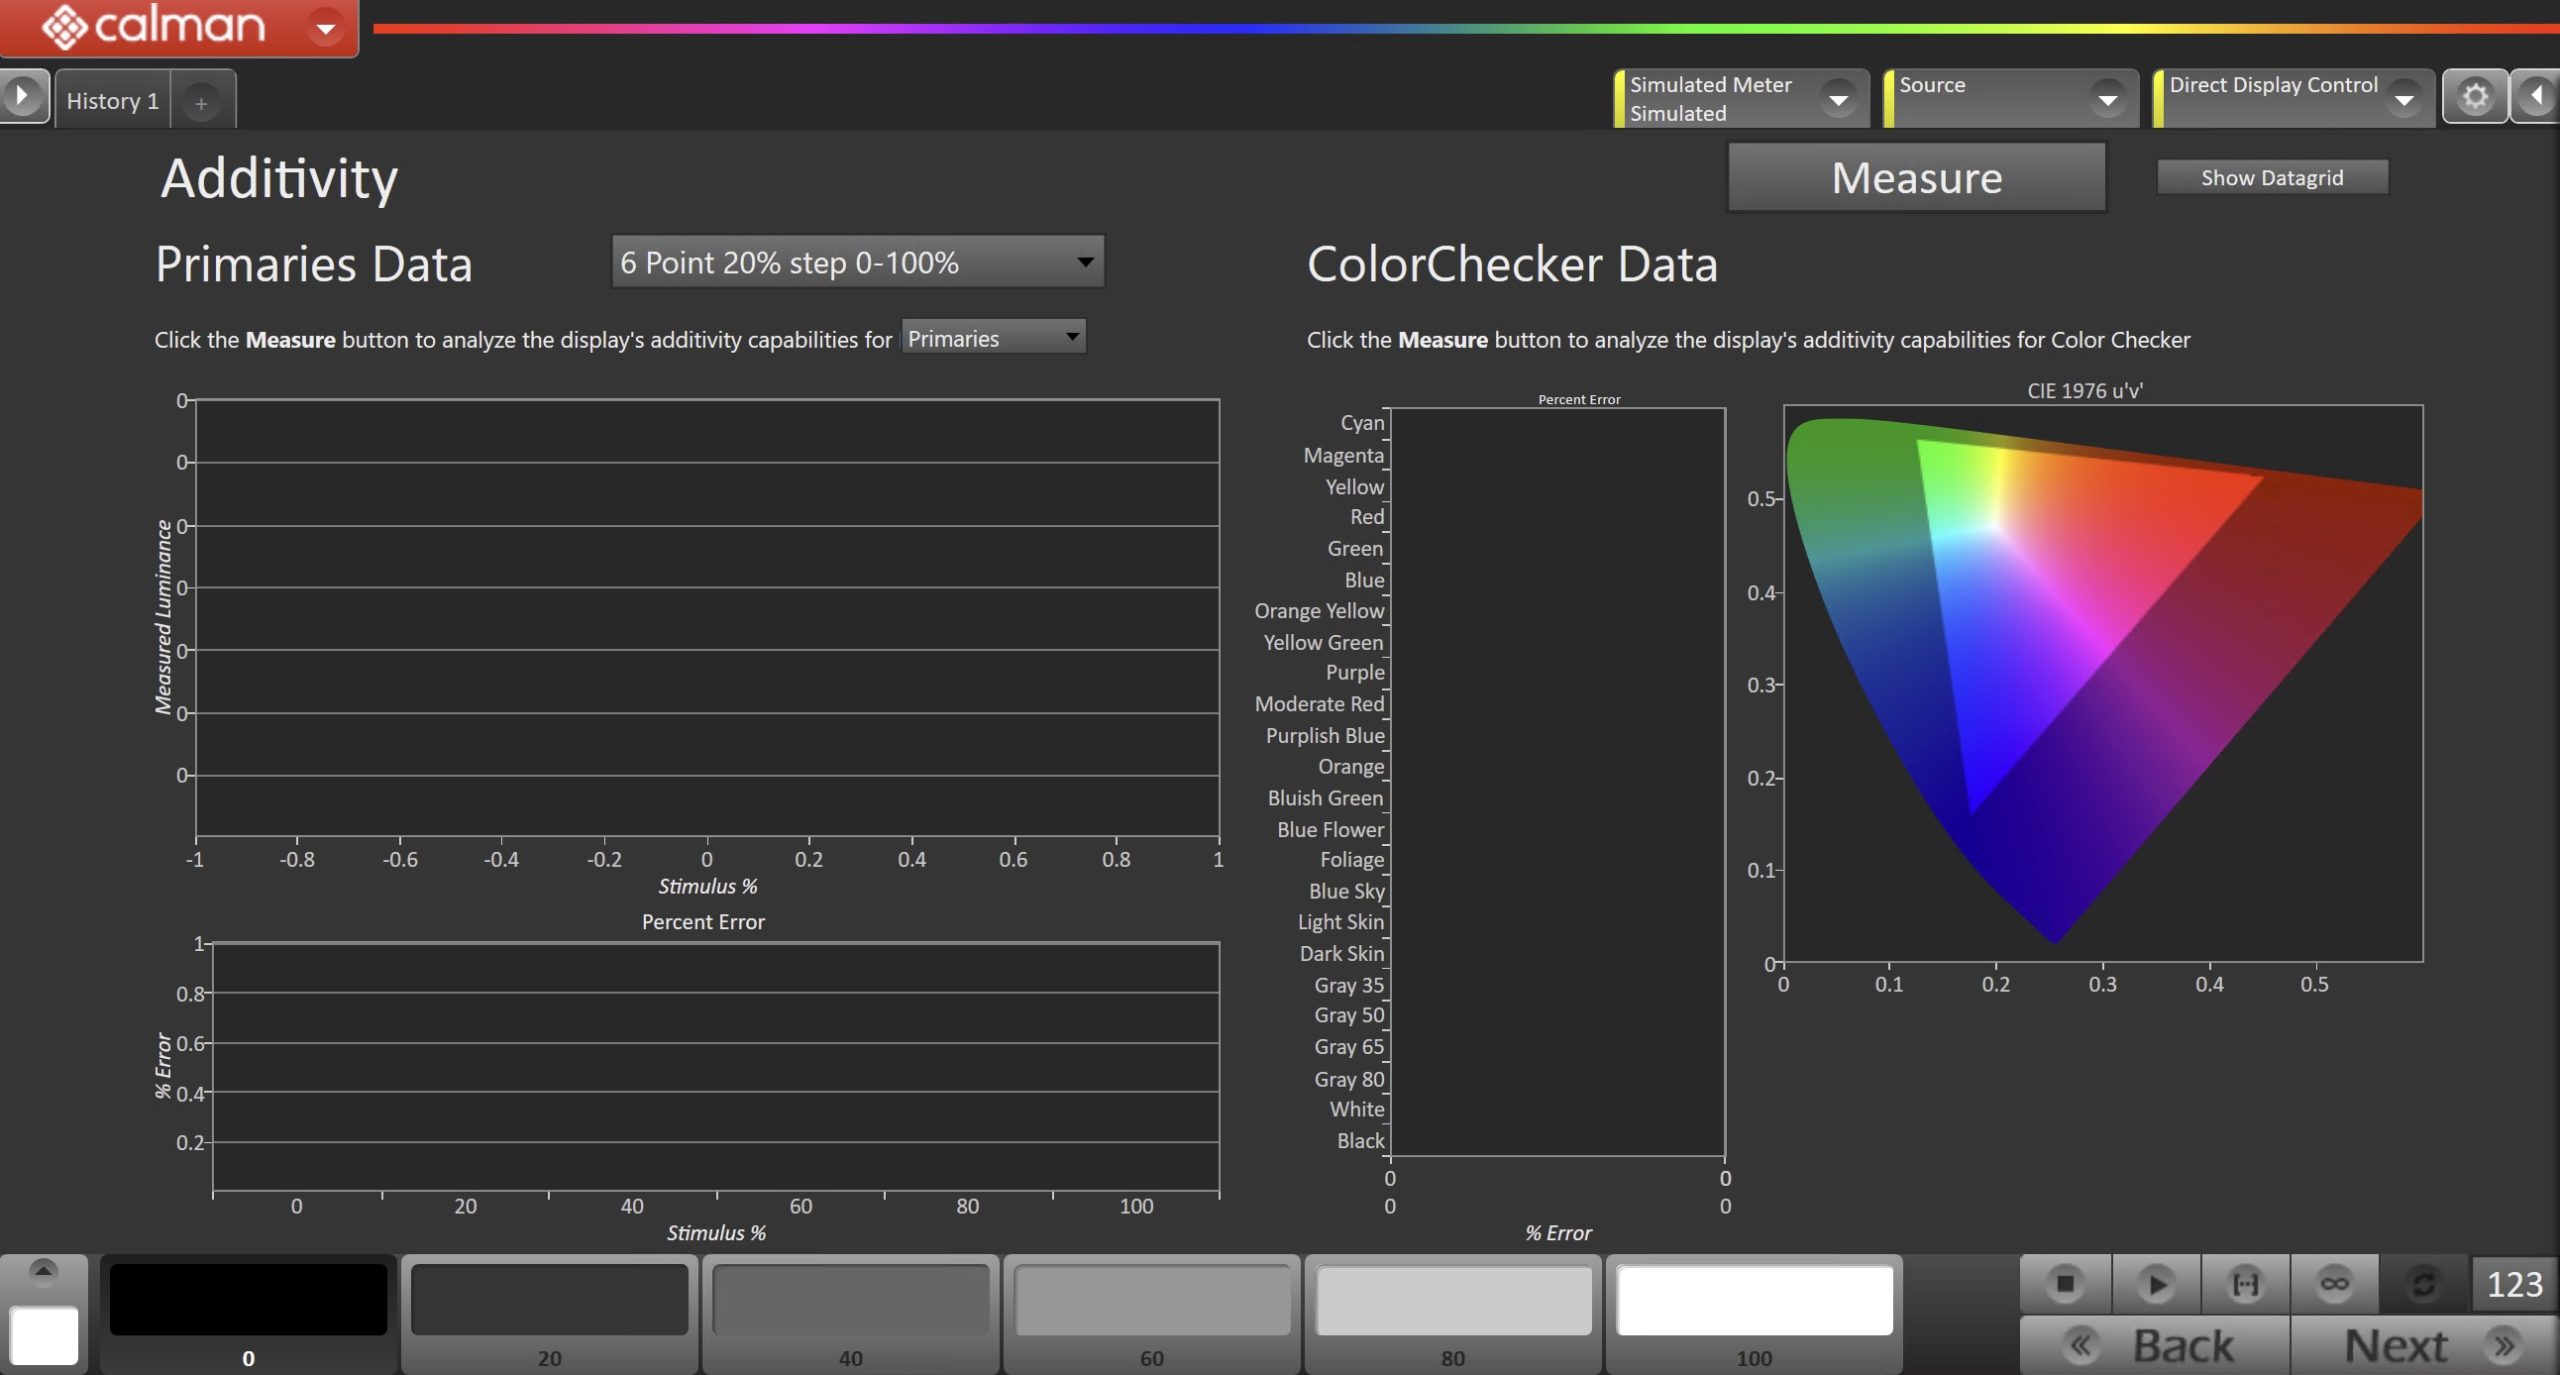
Additivity
For more info, see: Determining display additivity behavior with Calman
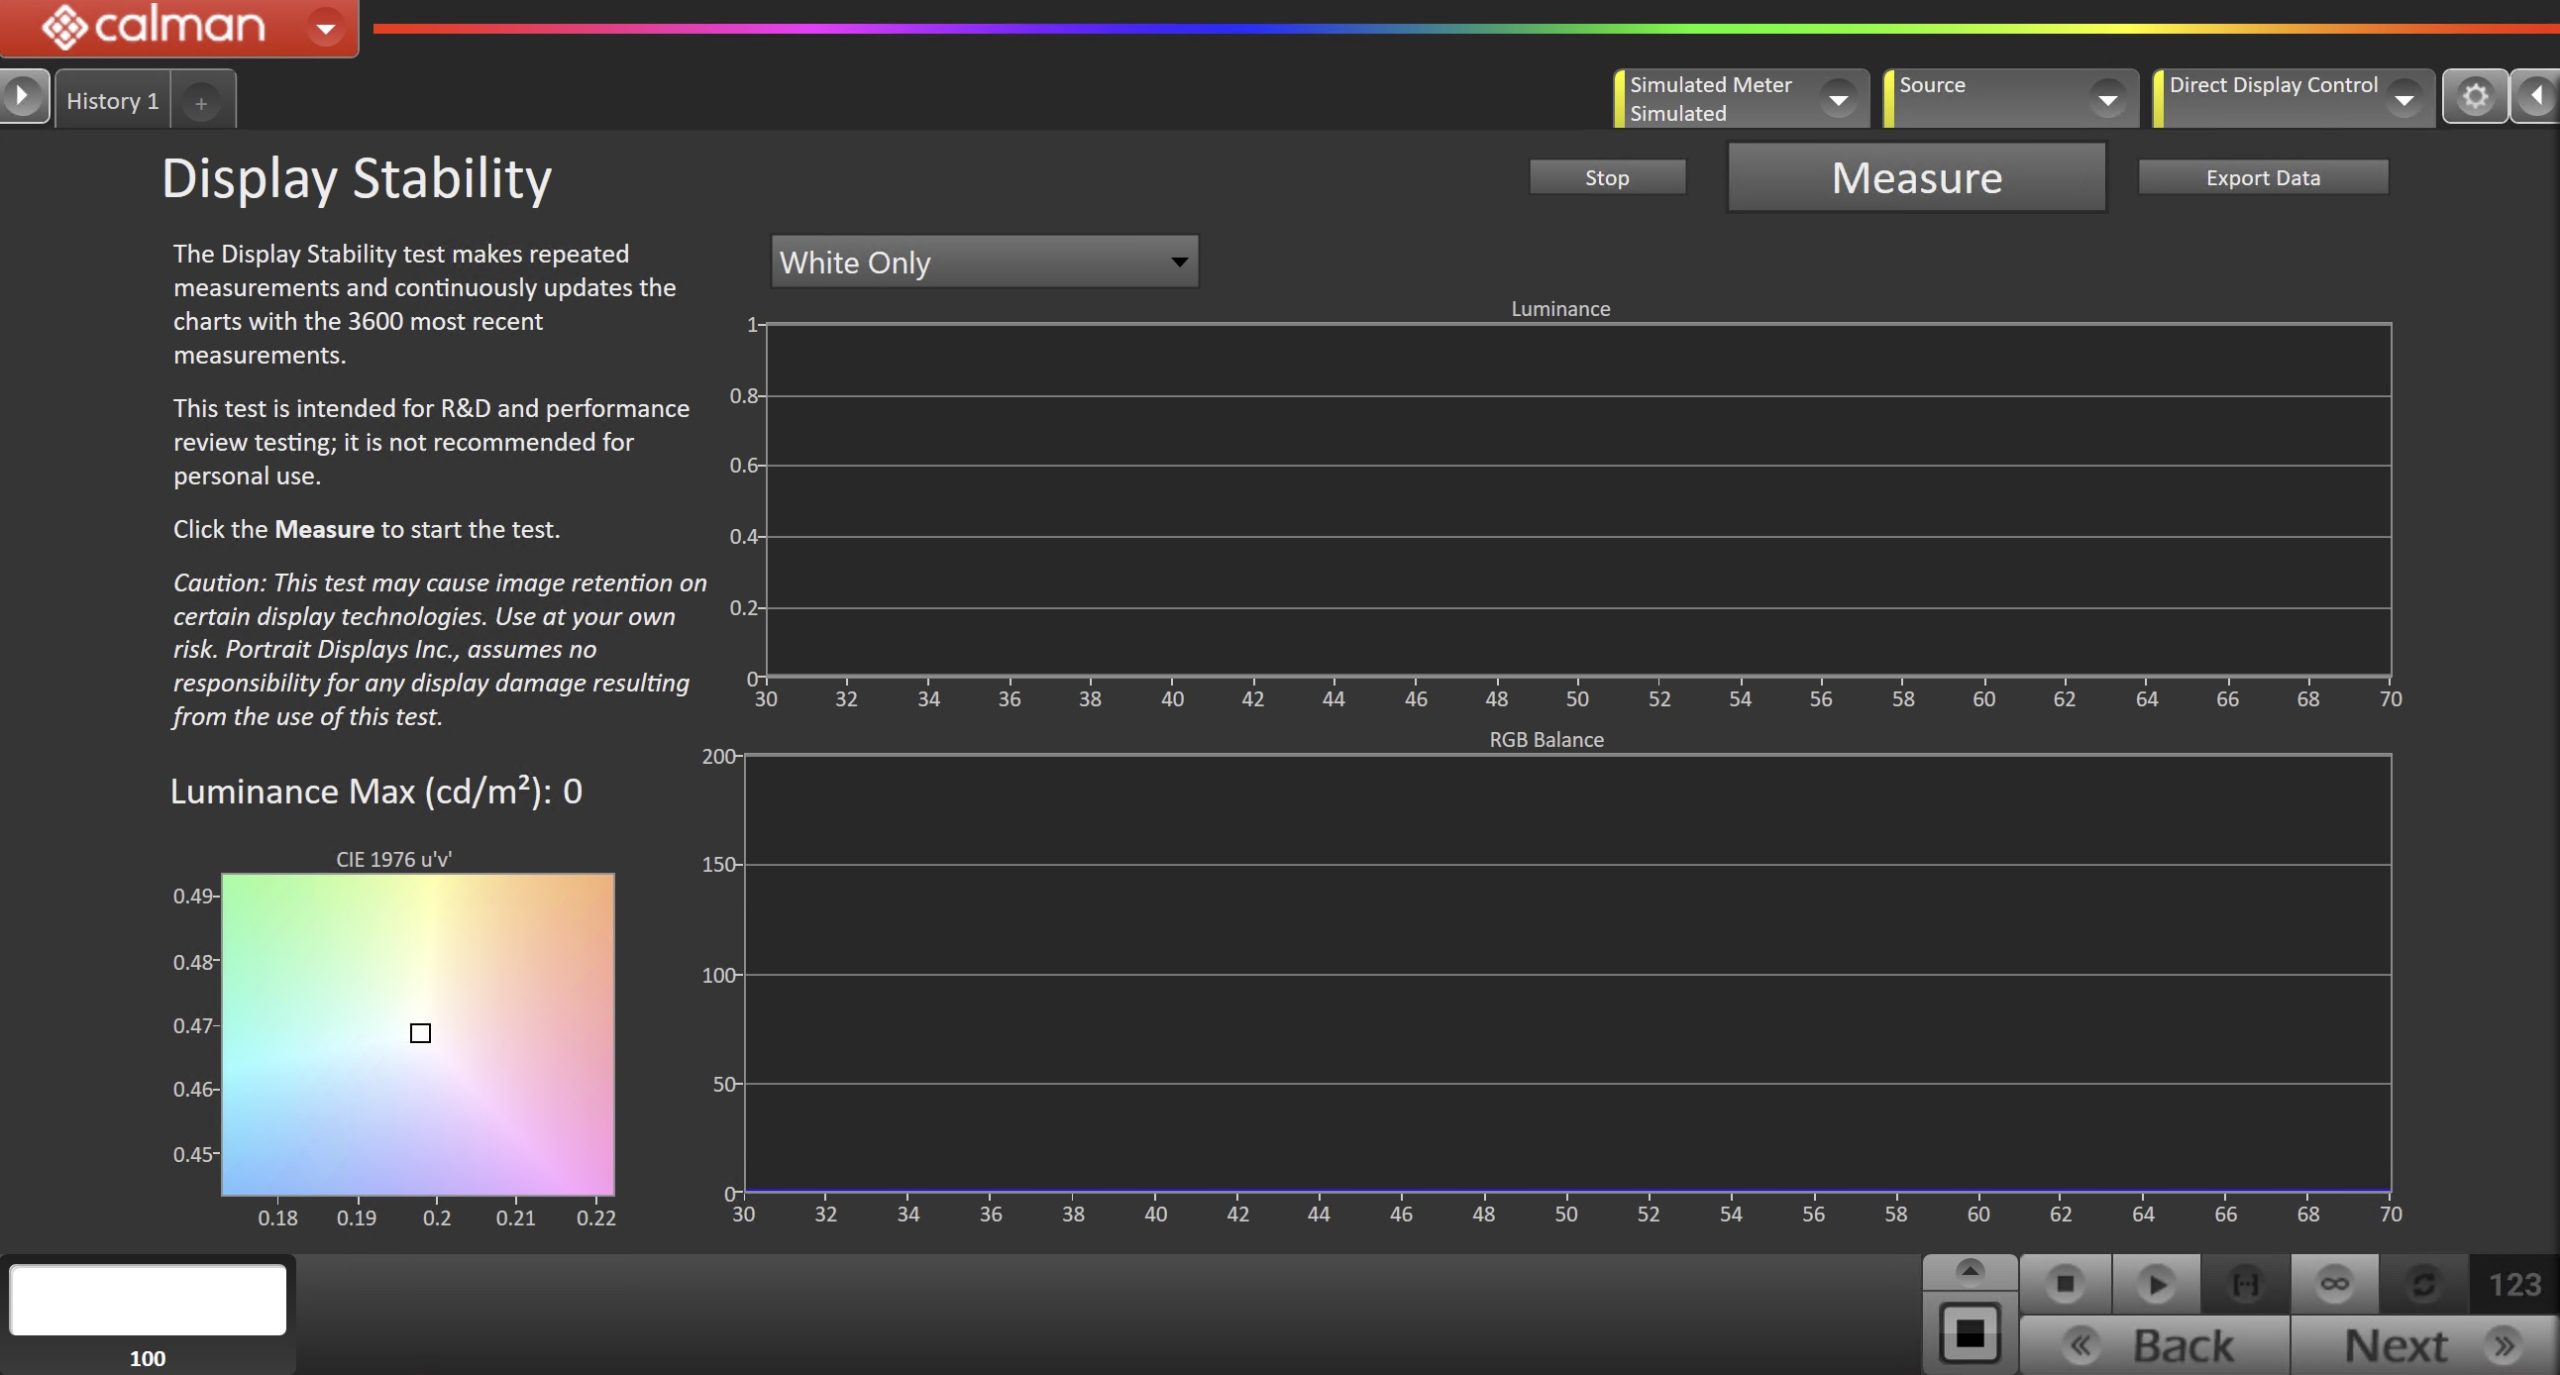
Display Stability
The Display Stability test makes repeated measurements and continuously updates the charts with the 3600 most recent measurements. This test is intended for R&D and performance review testing; it is not recommended for personal use.
|
Caution: This test may cause image retention on certain display technologies. Use at your own risk. Portrait Displays Inc., assumes no responsibility for any display damage resulting from the use of this test. |
- Click Measure to begin
Uniformity
This page is used to measure and evaluate how consistent/uniform a display performs at different physical locations on the panel.
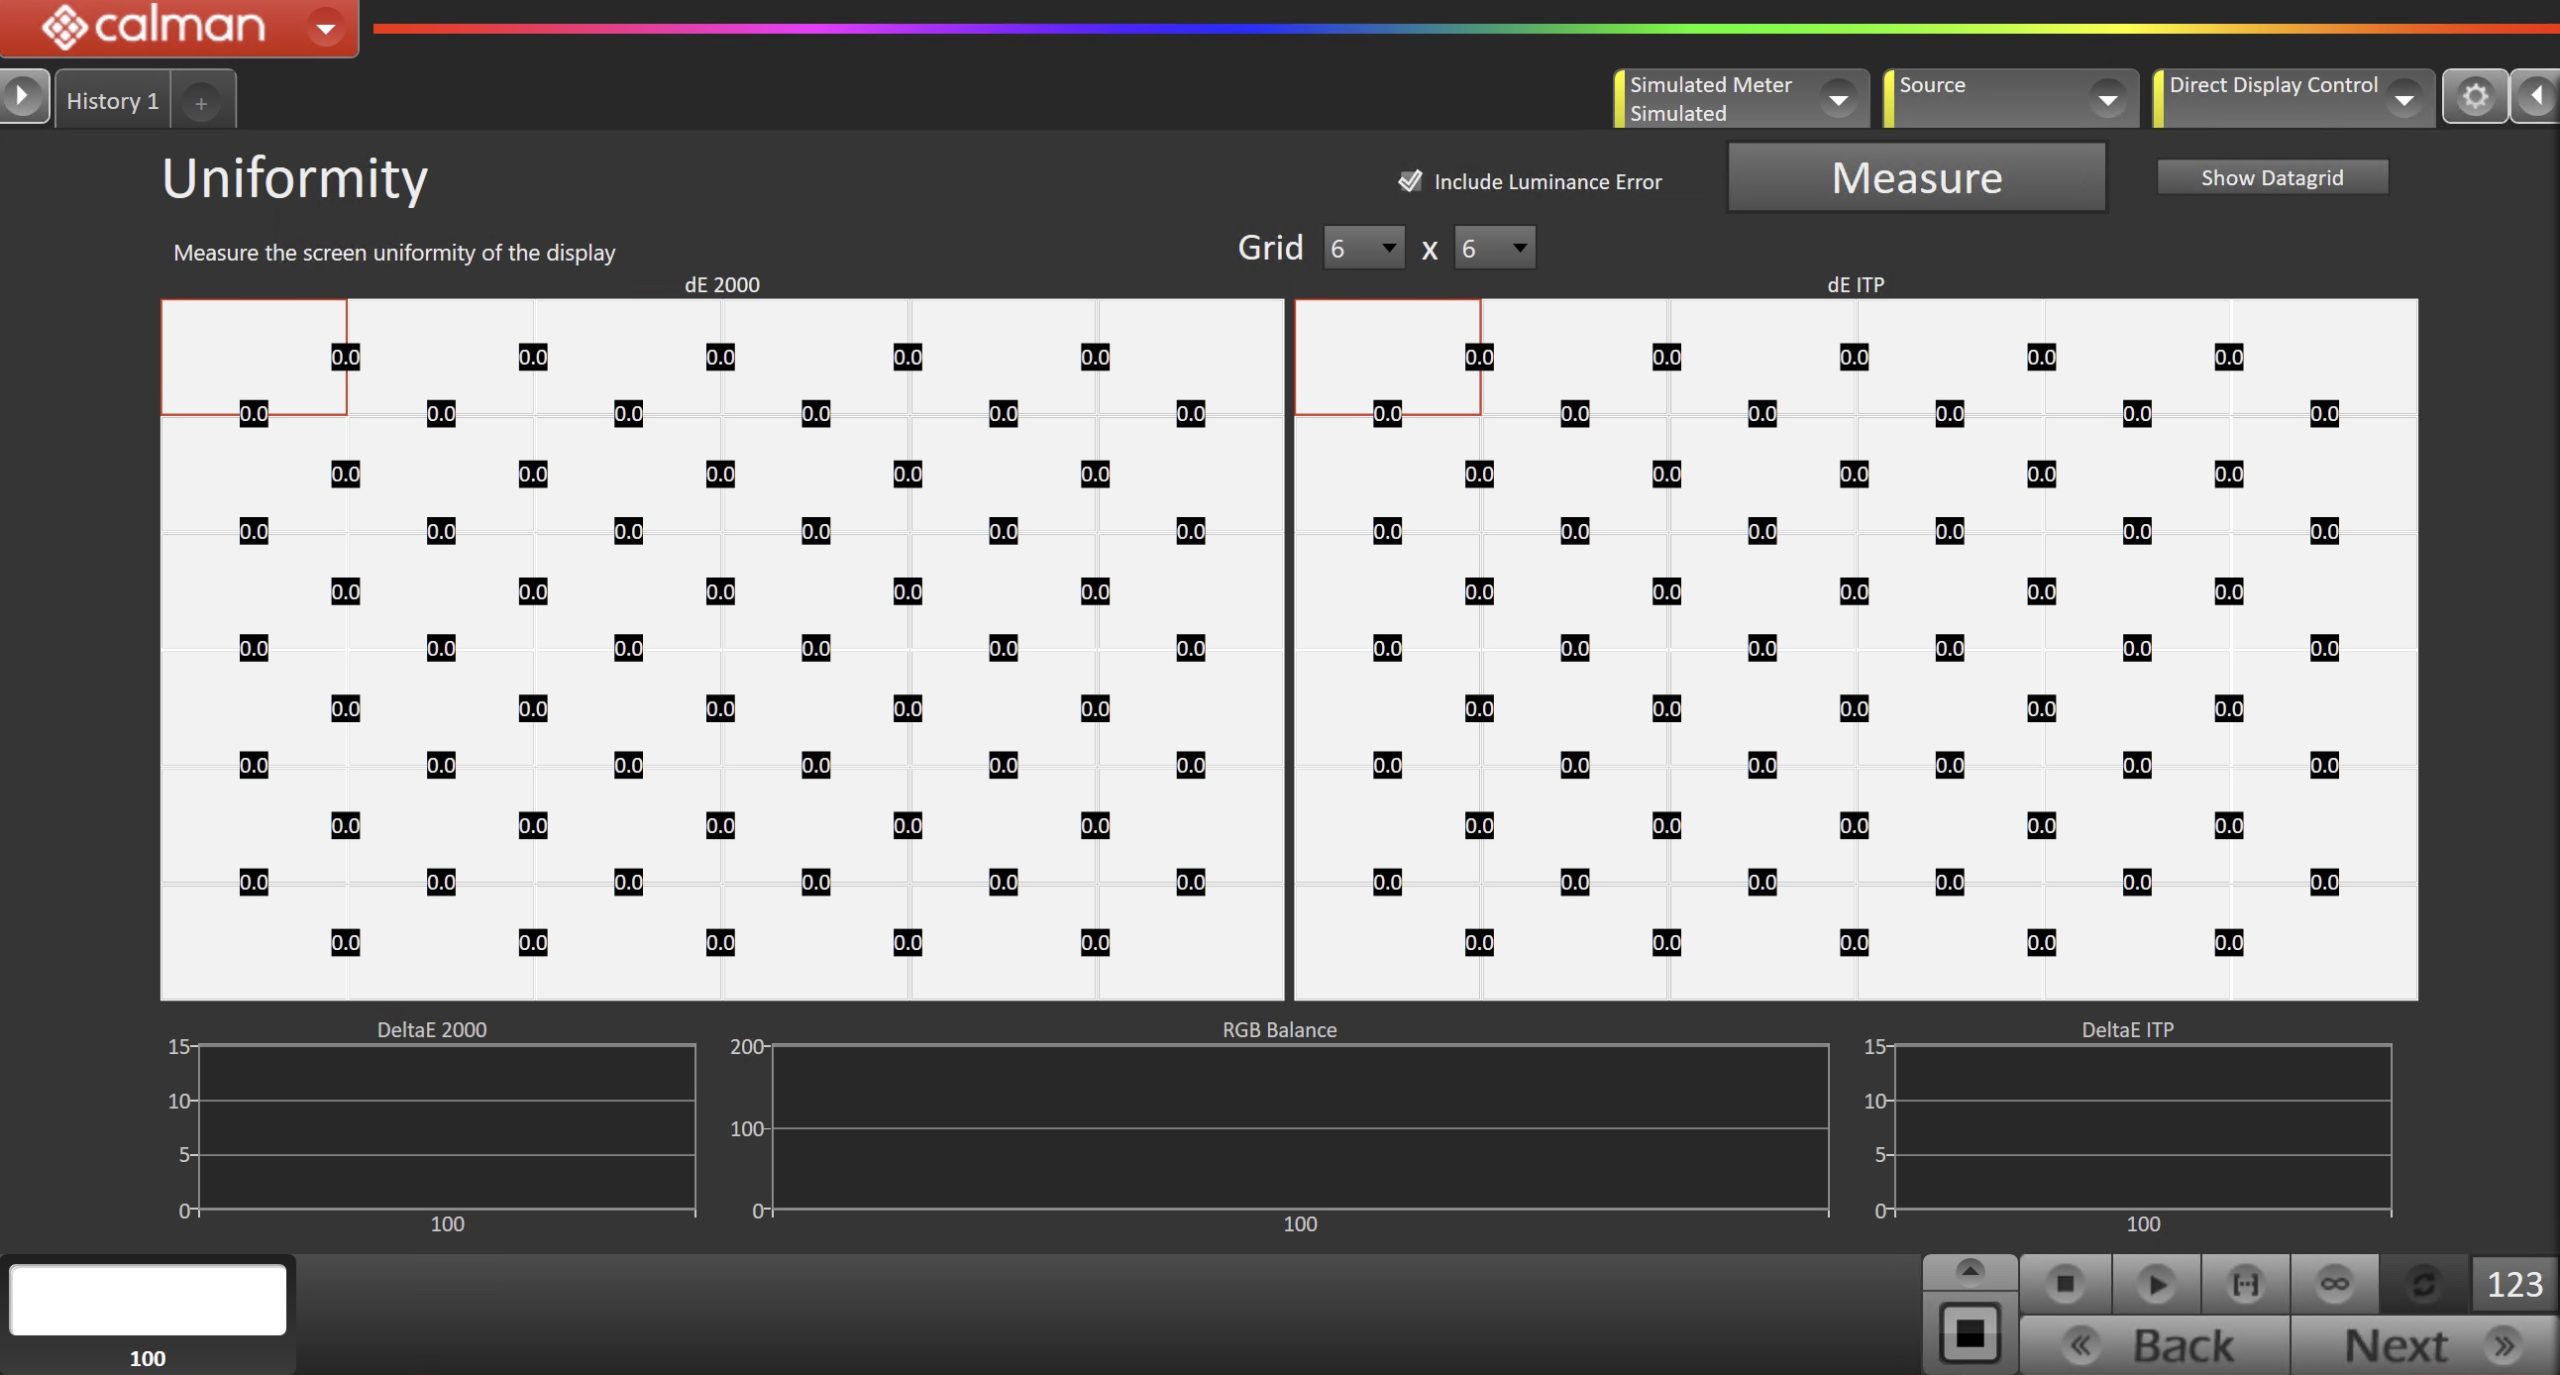
- Select your grid layout using the dropdown at the top. This will determine how many zones of measurement are used to evaluate the display
- Click Measure to begin
- Calman will walk you through measuring each zone individually before physically moving the meter to the next zone to measure.
Intra-Frame Contrast
Measure the 16-zone black and white checkerboard test pattern, in a totally dark room, to determine the display’s intra-frame contrast ratio.
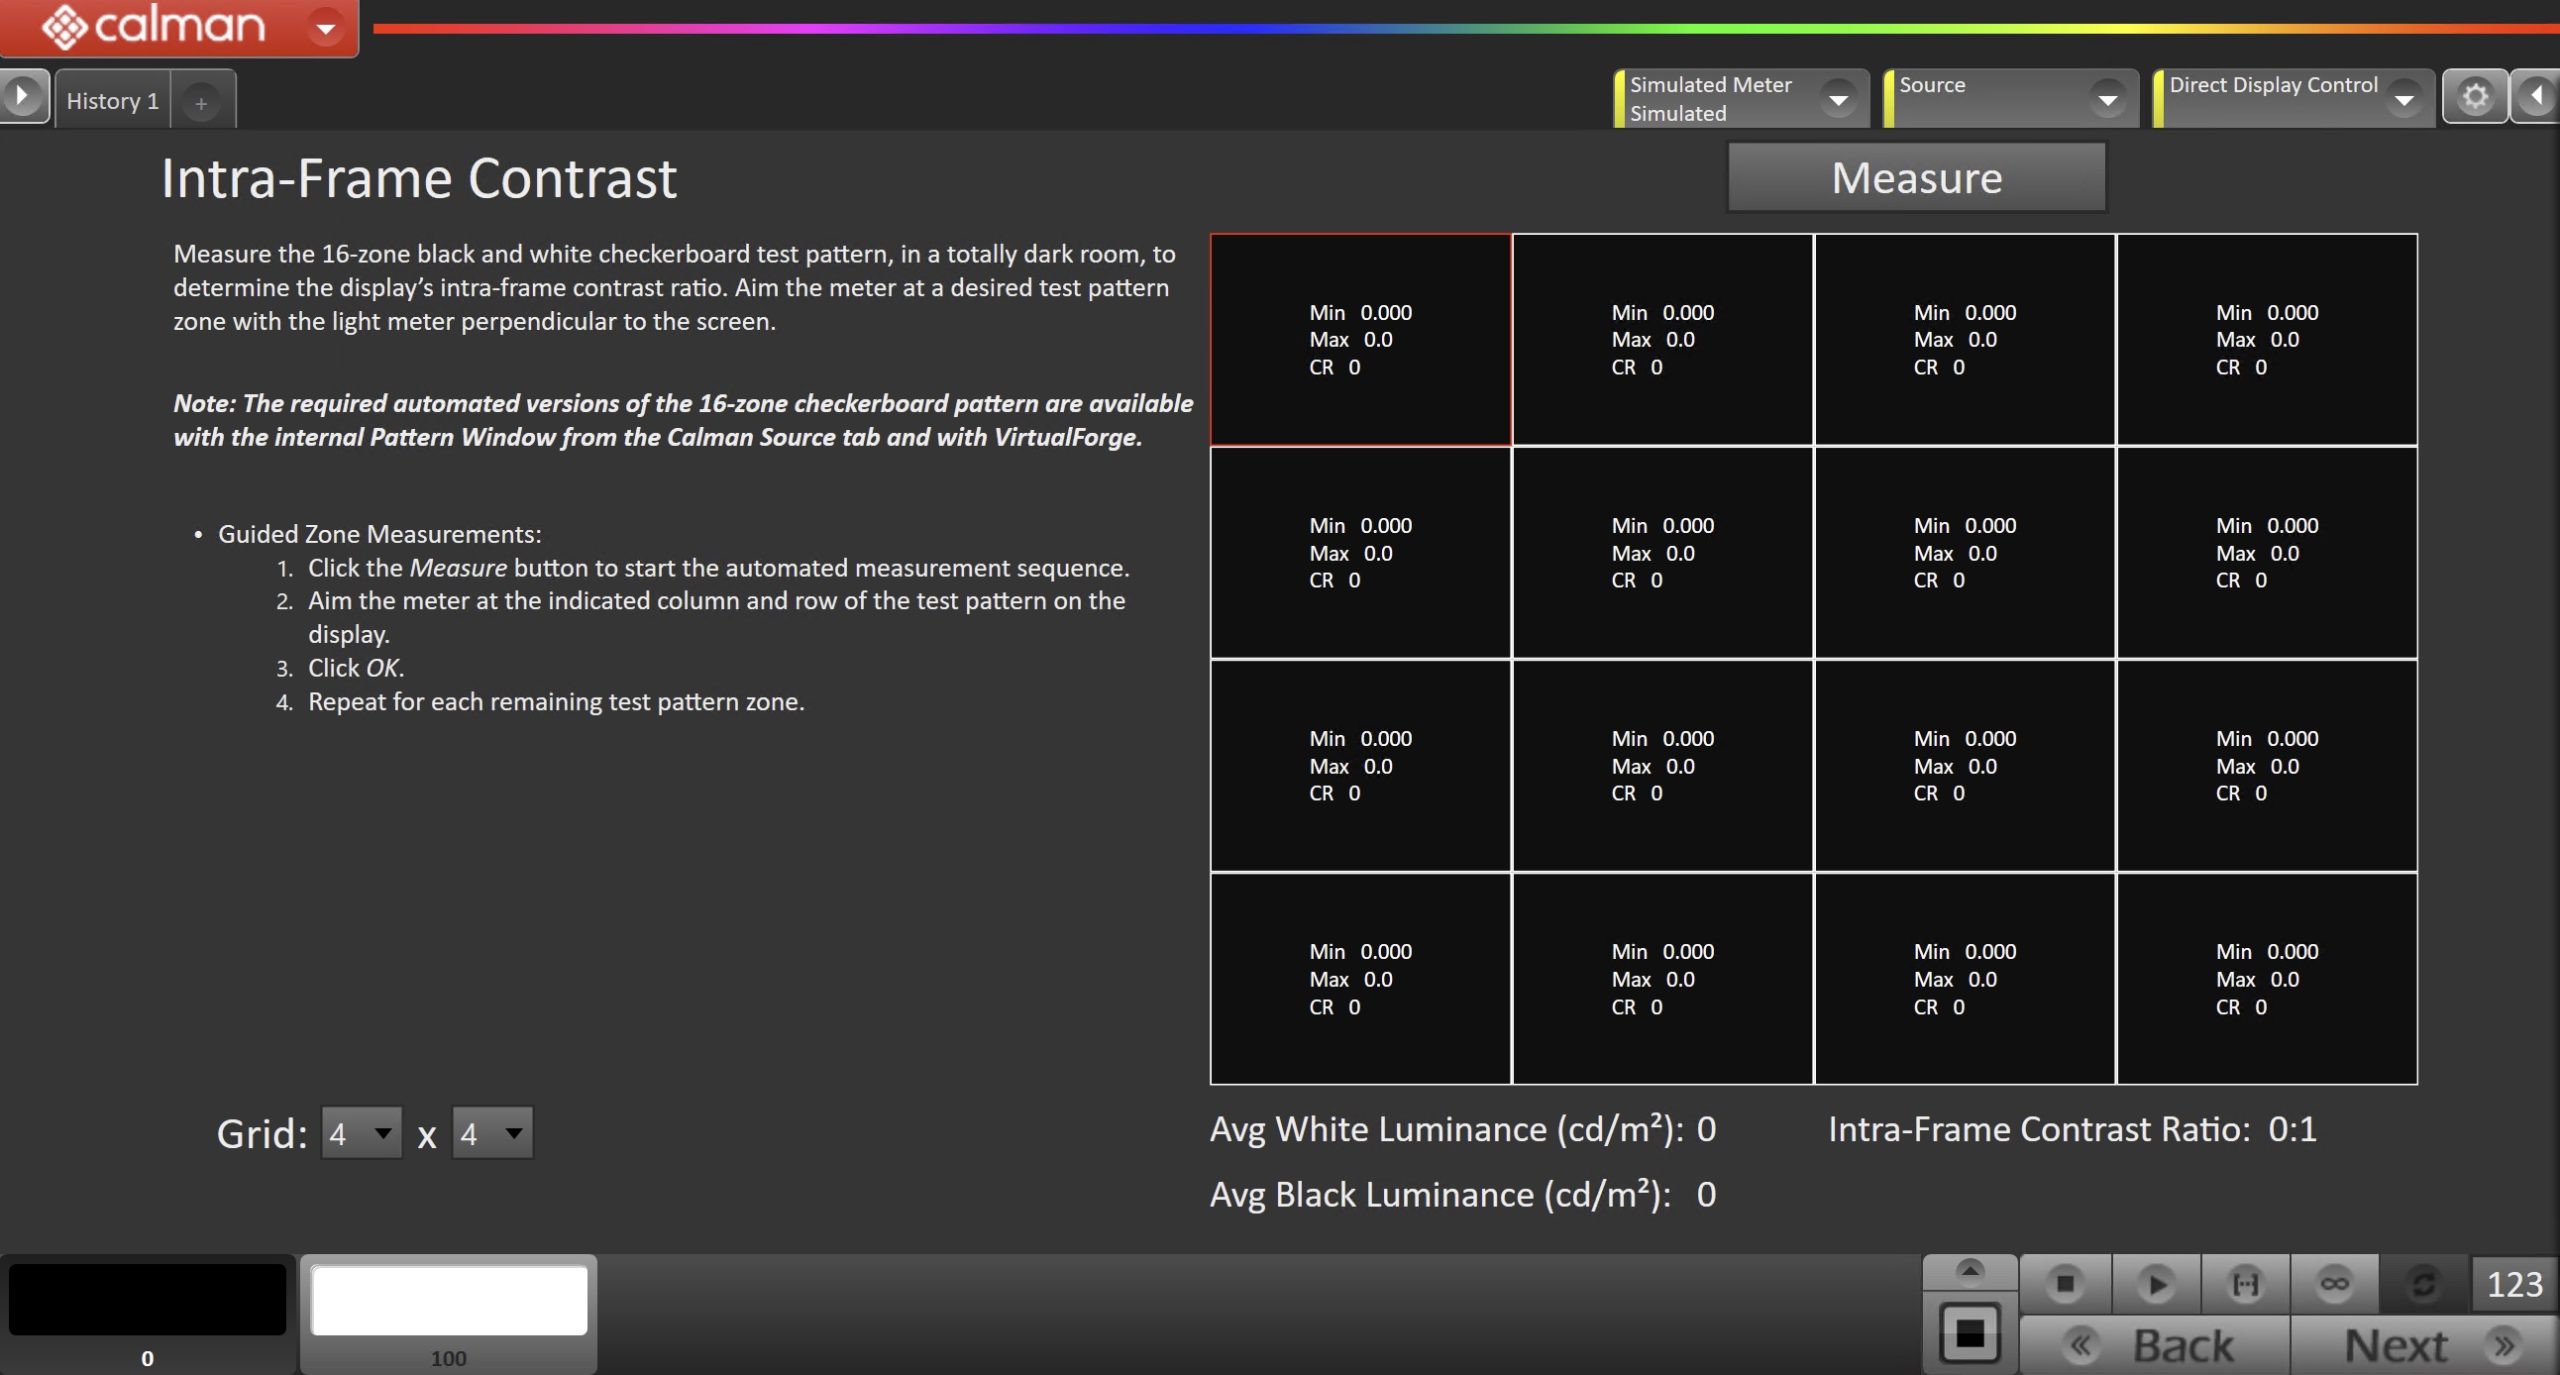
- Click the Measure button to start the automated measurement sequence.
- Aim the meter at the indicated column and row of the test pattern on the display.
- Click OK.
- Repeat for each remaining test pattern zone.
Sequential Contrast
Measure a display’s white luminance level and its black luminance level to determine the display’s sequential contrast ratio
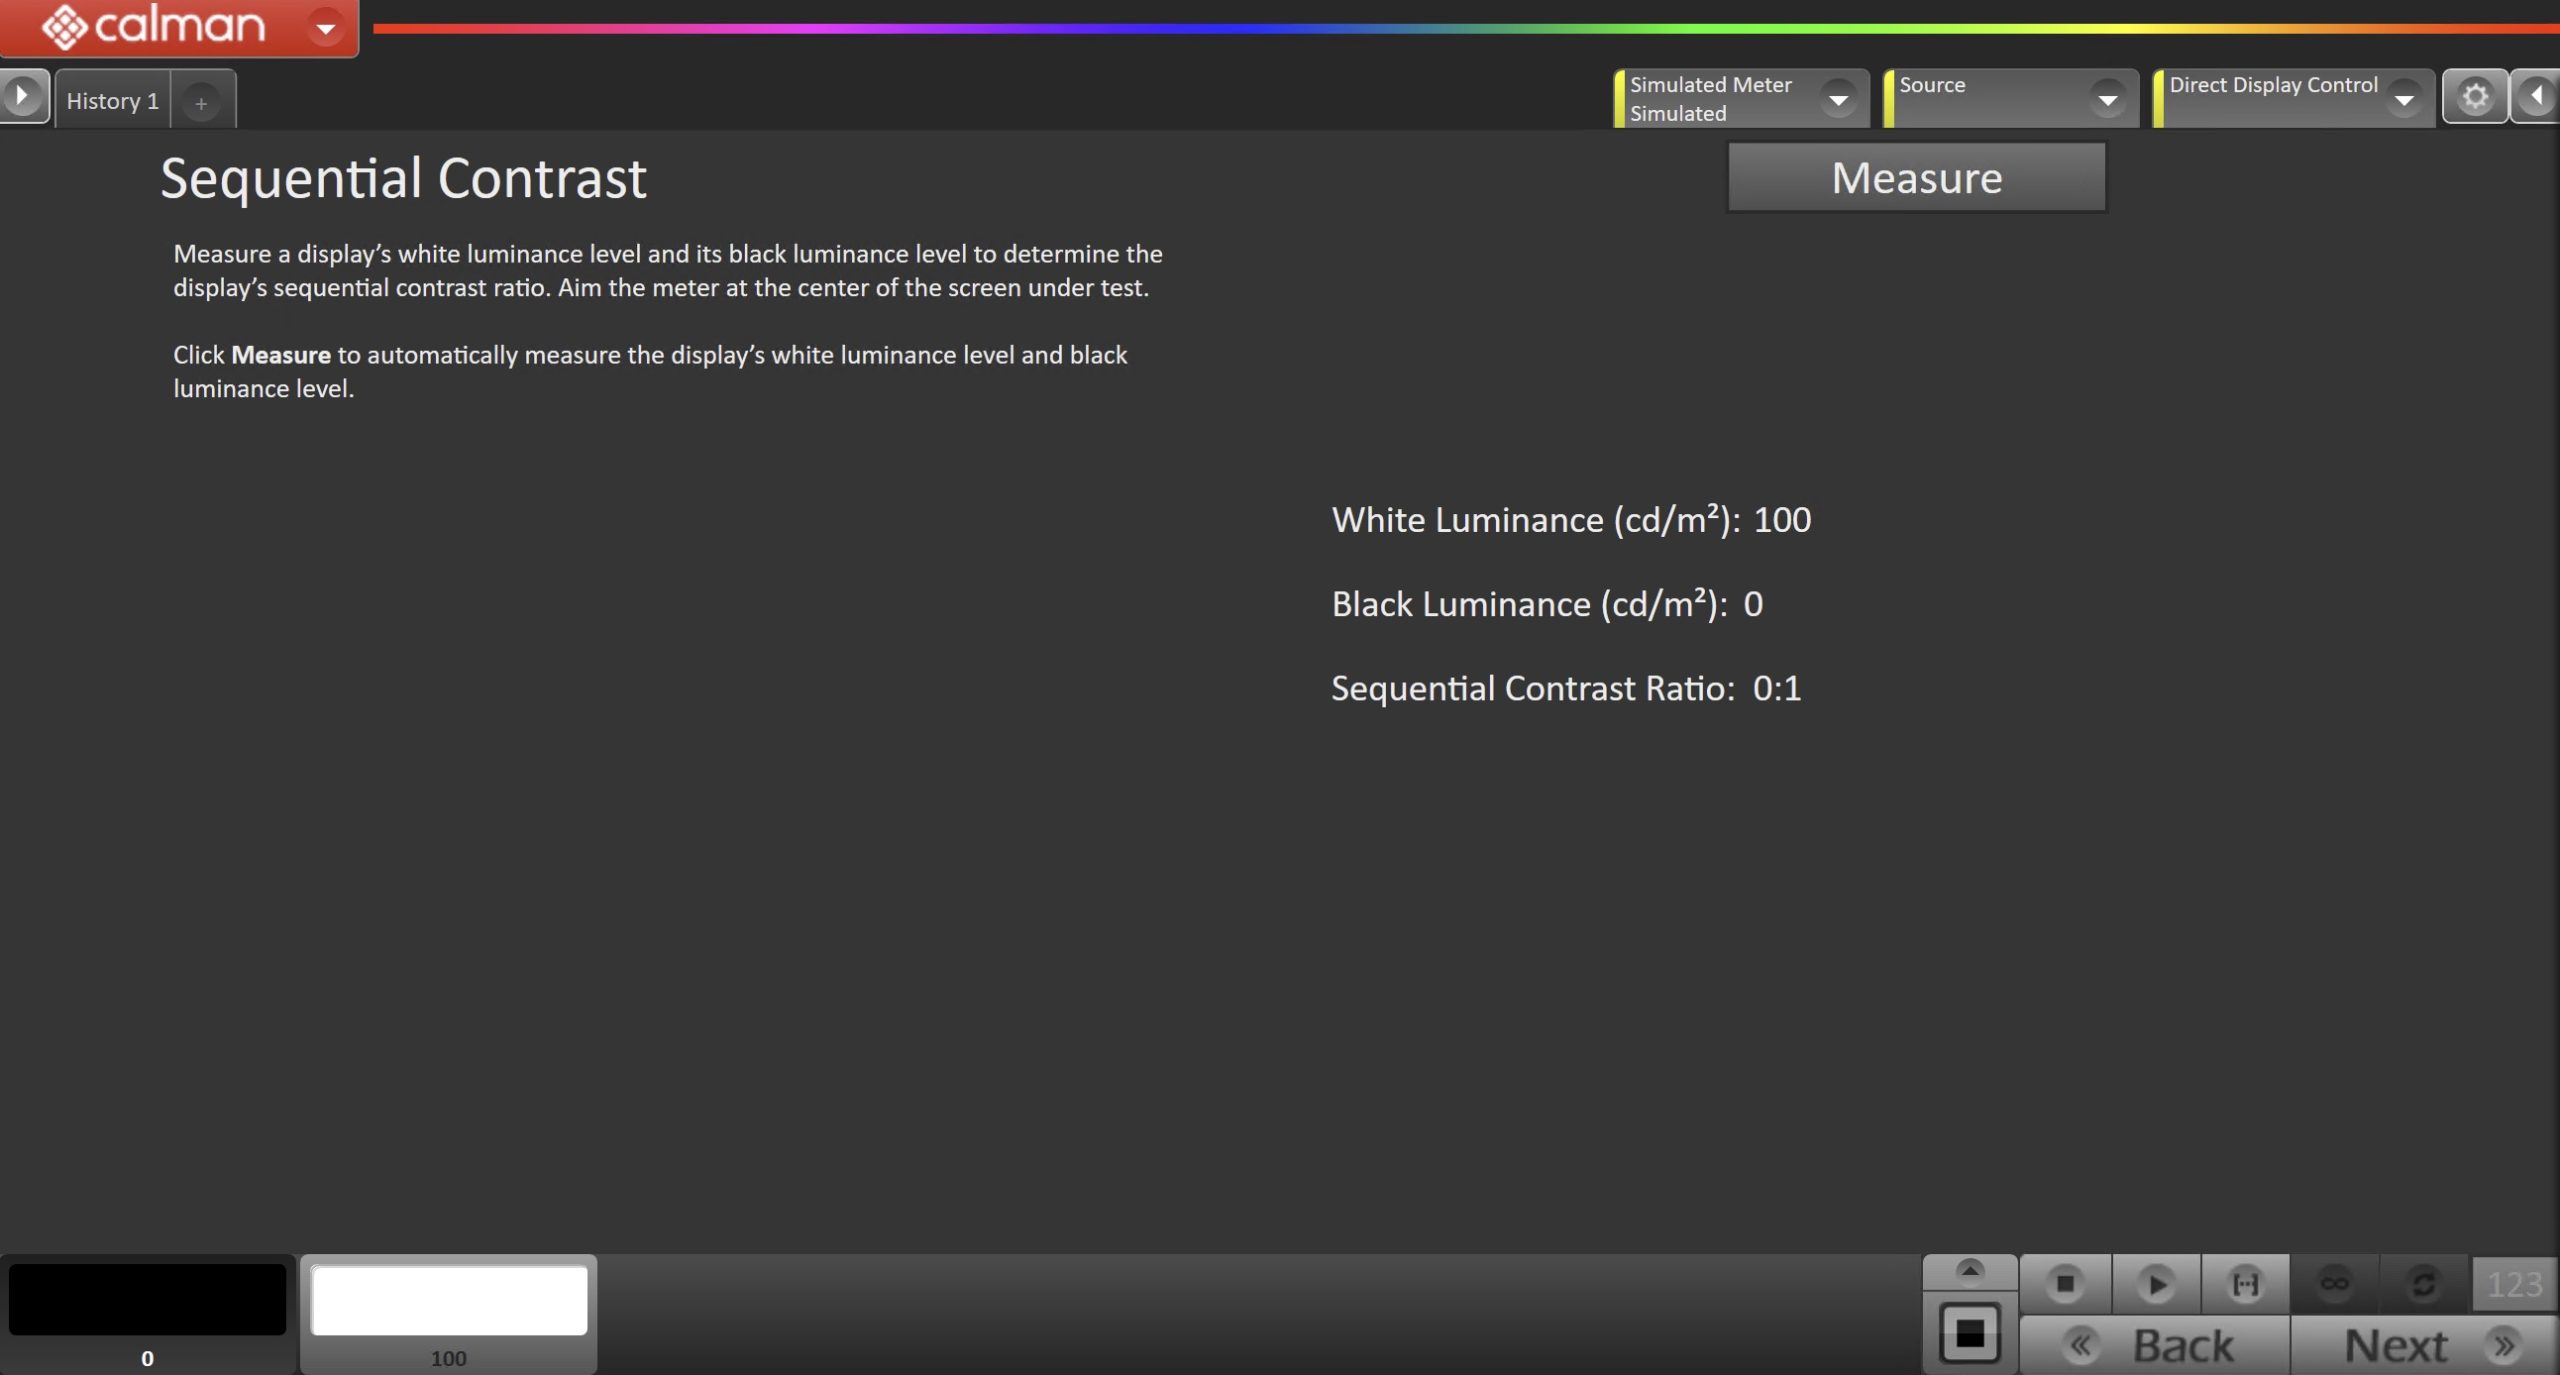
- Click Measure to begin
Snapshot
Similar to the Pre-Calibration and Post-Calibration layouts on many Calman workflows, this gives you an overall evaluation of a display’s performance.
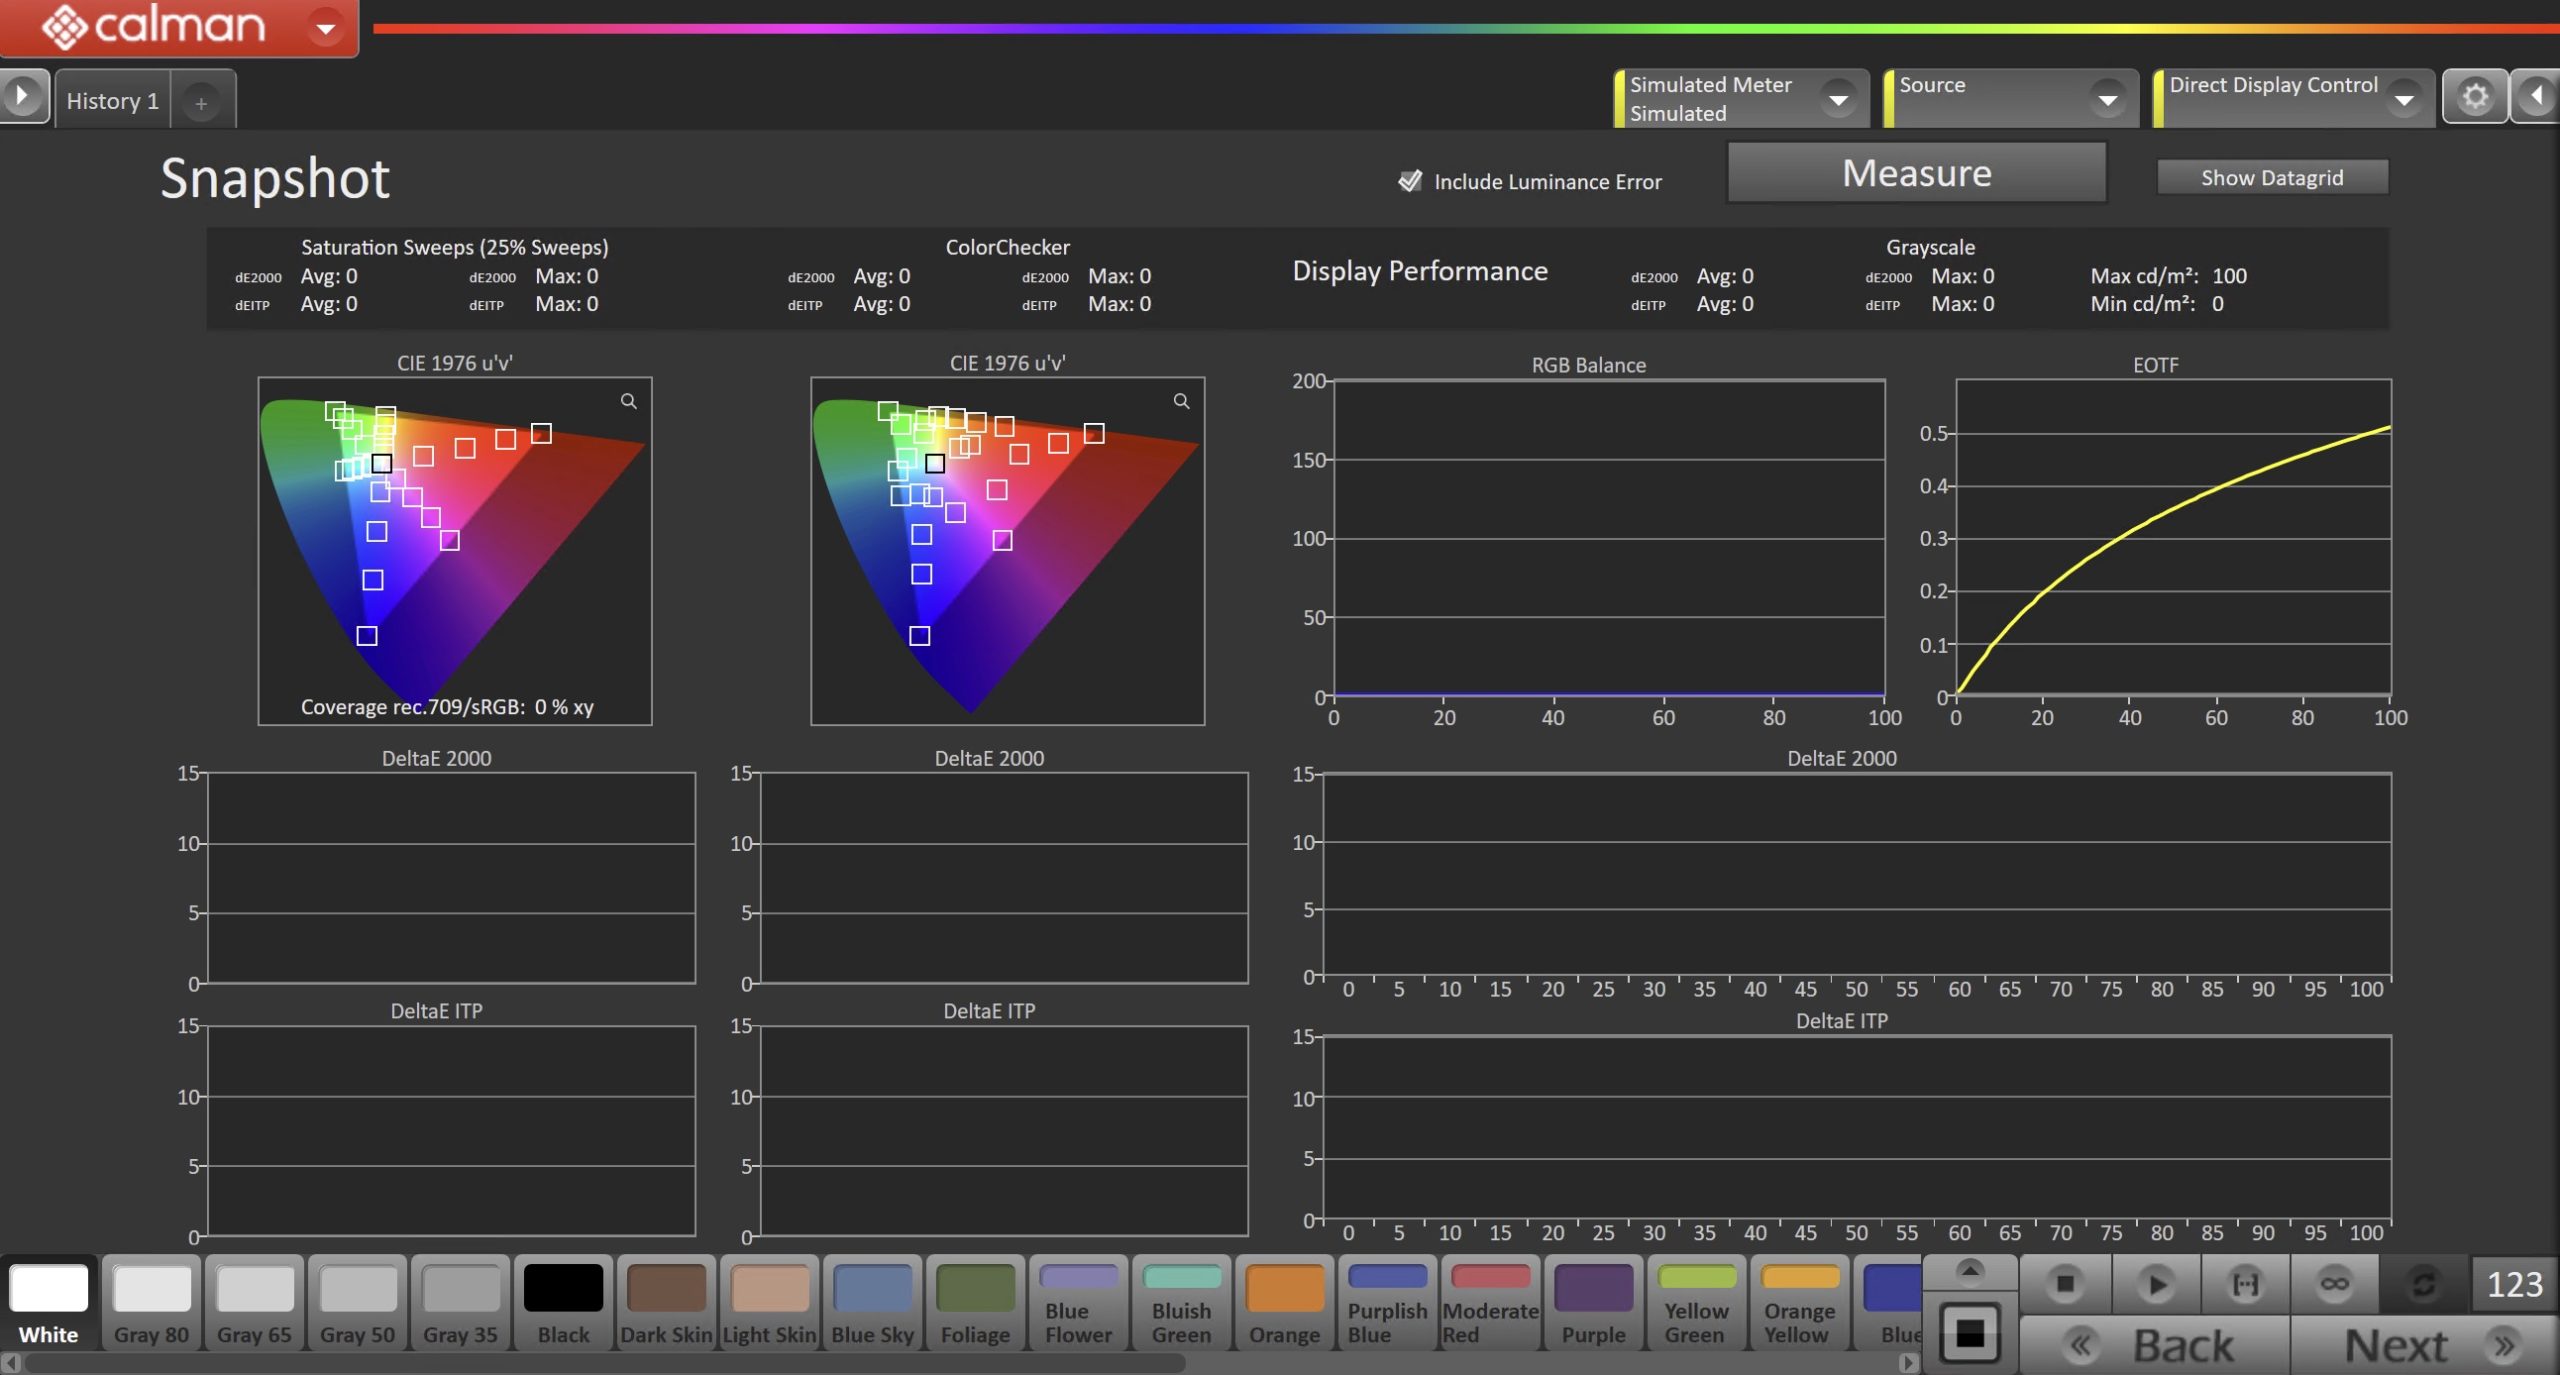
- Click Measure to begin